
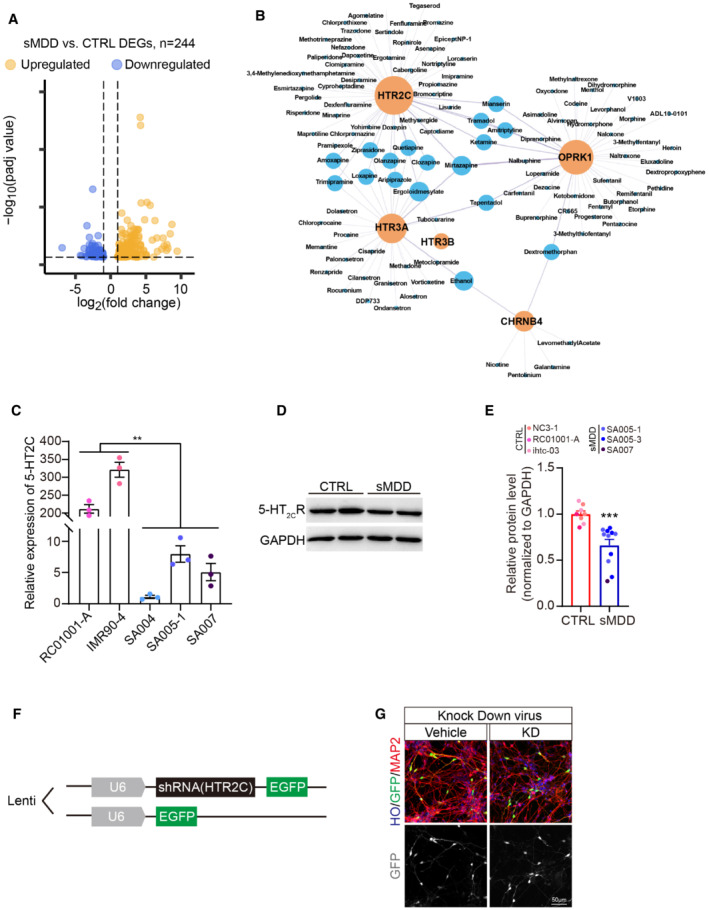
Figure EV4. Validation of HTR2C downregulating in sMDD. Related to Fig 4 .
-
AVolcano plot showing all differentially expressed genes between three CTRL and three sMDD samples in bulk RNA‐seq.
-
BNetwork maps highlighting genes from DEGs with the most targeted molecules according to the Drug Bank database. Yellow dots represent genes, and the blue dots are drugs related to two genes.
-
CRelative expression levels of 5‐HT2CR at days 35–40 from two CTRL cell lines and three sMDD cell lines using qPCR. n = 3 from each cell line. Nested t‐test, **P = 0.0077. Mean ratio ± SEM.
-
D, EWestern blotting analysis and quantification of 5‐HT2CR expression in GINs at days 35–40 from three CTRL cell lines and three sMDD cell lines. T‐test, ***P = 0.0007 for CTRL versus sMDD. CTRL, n = 8 from three cell lines; sMDD, n = 11 from three cell lines. Mean ratio ± SEM.
-
FSchematic diagram of knockdown lentivirus sequence.
-
GRepresentative images of shRNA knockdown virus‐infected neurons. Scale bar = 50 μm.
Source data are available online for this figure.