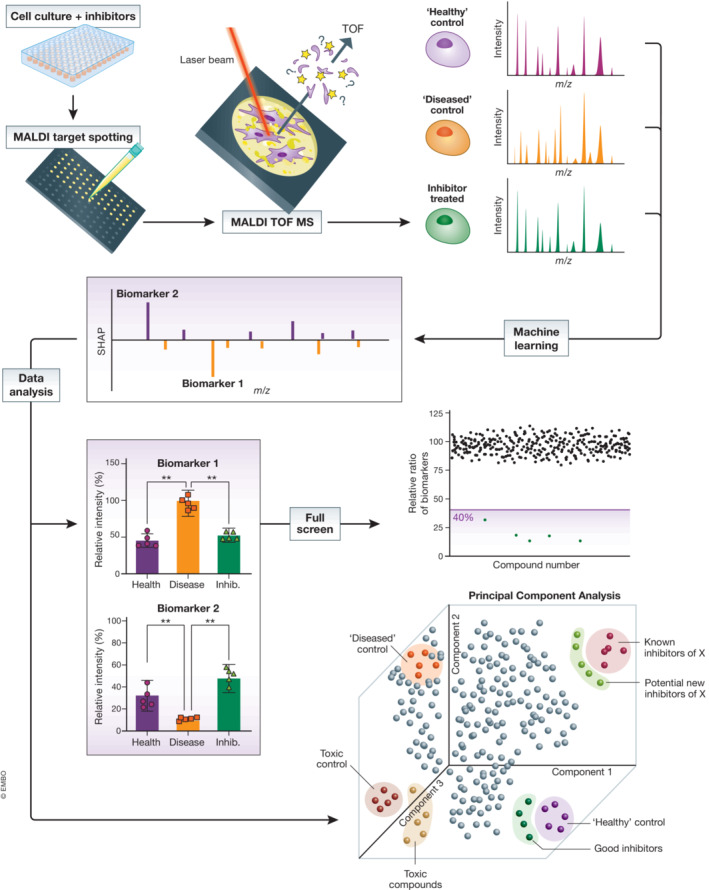
Figure 4. Cellular phenotypic assays by MALDI‐TOF mass spectrometry.

Cells or extracts of cells are spotted by liquid handling robots onto a MALDI target. MALDI‐TOF MS analysis of these samples defines “fingerprints” of “healthy” and “diseased” controls. Characterization of these complex fingerprints, potentially through machine learning or dimensionality reduction analysis (such as principal component analysis), allows the identification of biomarkers specific for the phenotypes. Changes of these biomarkers can be used as a read‐out for a drug discovery screen against many chemical moieties. Since the readout produces information‐rich multi‐dimensional data, the use of known inhibitors and cytotoxic compounds can be used to multiplex and identify novel compounds in these pathways.
