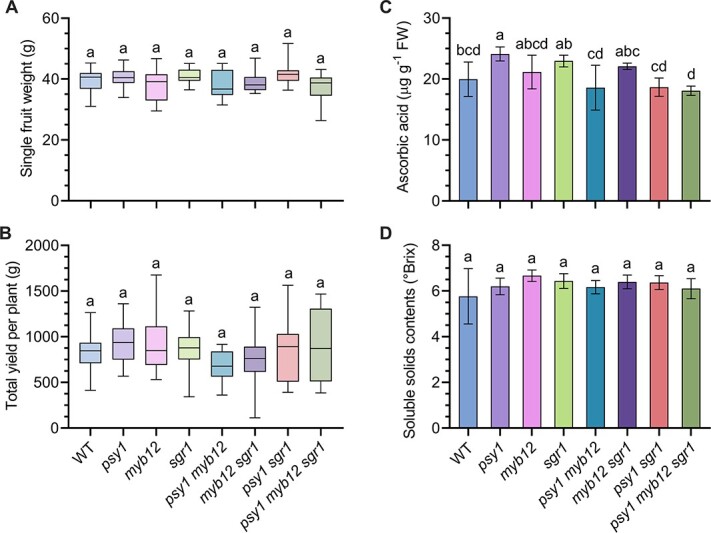
Figure 5.

Quantitative and qualitative analyses of the tomato fruits of WT plants and single (psy1, myb12, sgr1), double (psy1 myb12, myb12 sgr1, psy1 sgr1), and triple (psy1 myb12 sgr1) mutants in the BC1F1 generation. (A) Single-fruit weight. (B) Total yield per plant. (C) Ascorbic acid content, expressed as °Brix. (D) TSS content. Measurements were recorded using seven isolated homozygous mutant genotypes and WT plants. Data represent mean ± standard deviation of three biological replicates. Lower-case letters indicate significant differences (P < .05; Student’s t-test).
