
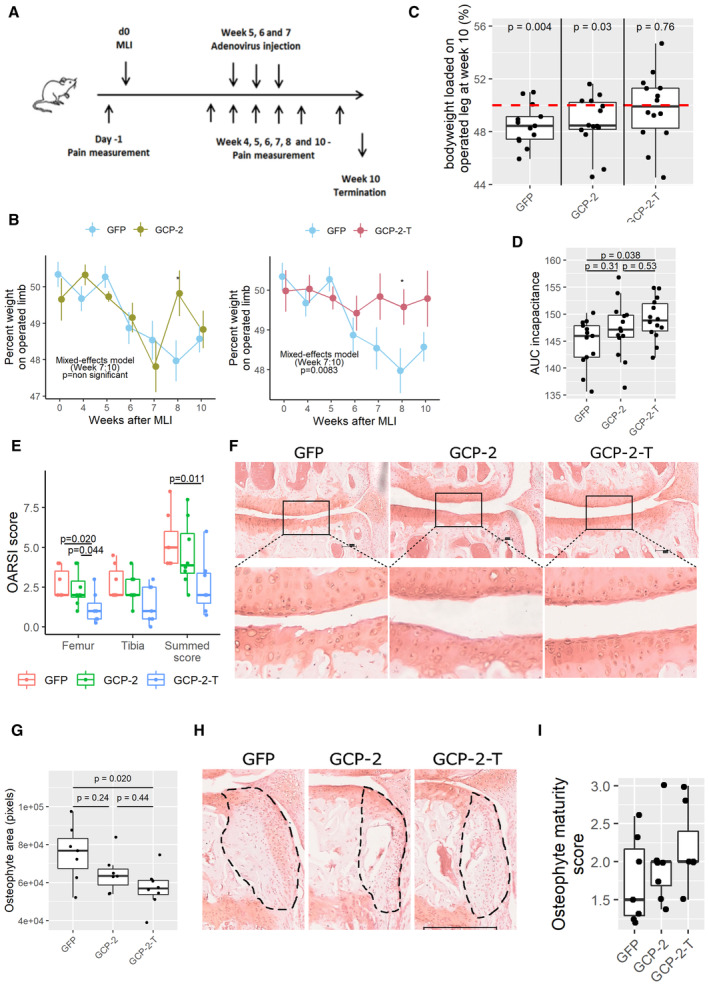
Figure 5. Exogenous GCP‐2‐T improves structural outcomes and pain in osteoarthritis.
-
ASchematic of in vivo experimental osteoarthritis.
-
BWeekly pain measurement by incapacitance, shown as the percentage of bodyweight loaded on the operated leg in GFP (n = 15) versus GCP‐2 (n = 14) and GFP versus GCP‐2‐T (n = 15) treated mice. Circles show the mean, and error bars show 95% confidence intervals. P‐values were determined by building a mixed‐effect linear model. *P < 0.05.
-
CIncapacitance at Week 10 (final time point); red line indicates 50% loading (no pain); P‐values were determined by unpaired, two‐tailed one sample Student's t‐test testing the hypothesis that mice loaded 50% body weight on the operated limb (n = 13 in the GFP group and n = 14 in the GCP‐2 and GCP‐2‐T groups).
-
DThe area under the curve (AUC) of incapacitance calculated starting from Week 6; P‐values were determined by ANOVA with Tukey's HSD post hoc test (n = 13 in the GFP group and 14 in the GCP‐2 and GCP‐2‐T group).
-
E, FOsteoarthritis severity assessed using (E) OARSI scoring system 10 weeks after MLI; GFP (n = 7), GCP‐2 (n = 8) and GCP‐2‐T (n = 7); P‐values were determined by fitting a generalized linear model followed by comparison of the estimated marginal means. F representative image (Safranin O staining) for each treatment; arrows indicate the tidemark; scale bar 100 μm.
-
GQuantification of osteophytes area; GFP (n = 7), GCP‐2 (n = 7) and GCP‐2‐T (n = 8); P‐values were determined by ANOVA with Tukey's HSD post hoc test.
-
HRepresentative images with osteophyte highlighted; scale bar 300 μm.
-
IOsteophyte maturity score (n = 7); P‐values were determined by fitting a generalized linear model followed by pairwise comparison of the estimated marginal means.
Source data are available online for this figure.