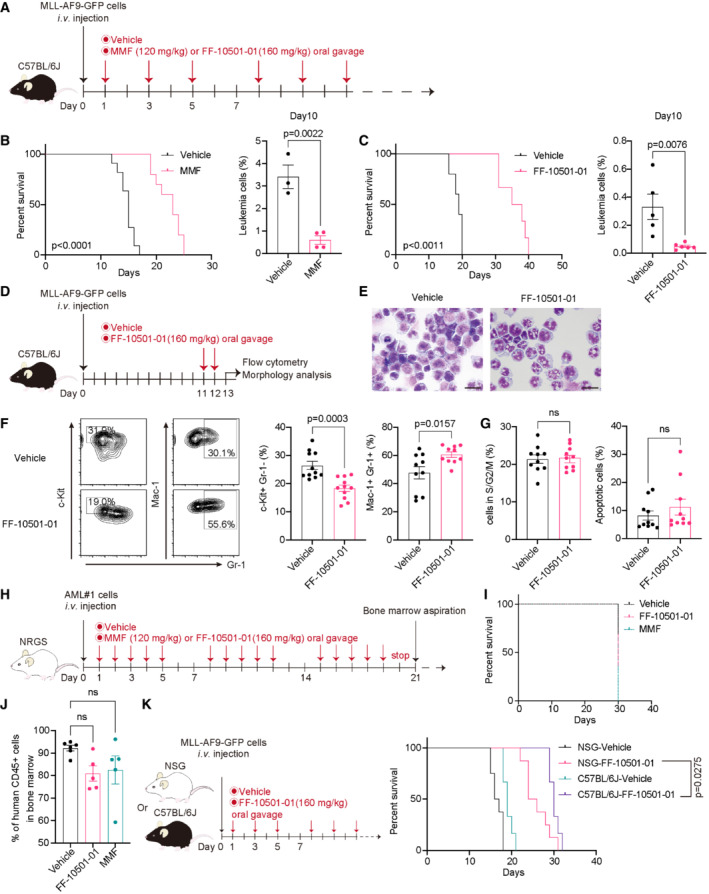
Figure 2. IMPDH inhibitors suppress the growth of MLL‐fusion leukemia in vivo .

- Experimental scheme used in (B and C). C57BL/6J mice were transplanted with MLL‐AF9‐GFP cells and were treated with vehicle or MMF or FF‐10501‐01.
- Kaplan–Meier survival curves of MLL‐AF9 leukemia mice treated with vehicle or MMF (n = 12 per group). Frequencies of GFP+ leukemic cells in peripheral blood at day10 are also shown (mean ± SEM) on the right side (vehicle: n = 3, MMF: n = 4). Unpaired Student's t‐test (two‐tailed) were used for pairwise comparisons of significance.
- Kaplan–Meier survival curves with vehicle (n = 5), FF‐10501‐01 (n = 10). Frequencies of GFP+ leukemic cells in peripheral blood at day10 are also shown (mean ± SEM) on the right side (vehicle: n = 5, FF‐10501‐01: n = 5). Unpaired Student's t‐test (two‐tailed) were used for pairwise comparisons of significance.
- Experimental scheme used in (E‐G). C57BL/6J mice were transplanted with MLL‐AF9‐GFP cells and were treated with vehicle or FF‐10501‐01 on day 11 and 12. GFP+ MLL‐AF9 leukemia cells collected from mice were analyzed on day 13.
- Wright‐Giemsa staining of MLL‐AF9 cells (Scale bar: 20 μm).
- Representative FCM plots of frequencies of c‐Kit+ Gr‐1− and Mac‐1+ Gr‐1+ in leukemic cells and their quantification of independent mice (n = 10 per group). Unpaired Student's t‐test (two‐tailed) were used for pairwise comparisons of significance.
- Cell‐cycle status (left) and apoptosis (right) were assessed. Frequencies of S/G2/M phase cells and Annexin V+ cells in GFP+ MLL‐AF9 leukemia cells (n = 10 per group). Two‐tailed unpaired t‐tests were used for the comparison.
- Experimental scheme used in (I and J). MPA‐sensitive patient AML#1 (MLL‐AF10) cells were transplanted to NRGS mice and treated with vehicle, MMF or FF‐10501‐01 5 days per week for 3 weeks.
- Kaplan–Meier survival curves of PDX‐transplanted leukemia mice treated with vehicle (n = 6), MMF (n = 5), or FF‐10501‐01 (n = 5).
- Frequency of human CD45+ cells in bone marrow at day 22 in mice described in (I). Ordinary one‐way ANOVA was used for the comparison.
- Experimental scheme (left). MLL‐AF9‐GFP cells were transplanted into immunocompetent C57BL/6J mice and immunodeficient NSG mice. Dose schedule with vehicle or FF‐10501‐01 are the same as described in (A). Kaplan–Meier survival curves were also shown on the right (NSG‐vehicle: n = 8, NSG‐FF‐10501‐01: n = 8, C57BL/6J‐vehicle: n = 6, C57BL/6J‐FF‐10501‐01: n = 6).
Data information: All data are shown as mean ± SEM. Log‐rank test was used to compare the survival curves.
