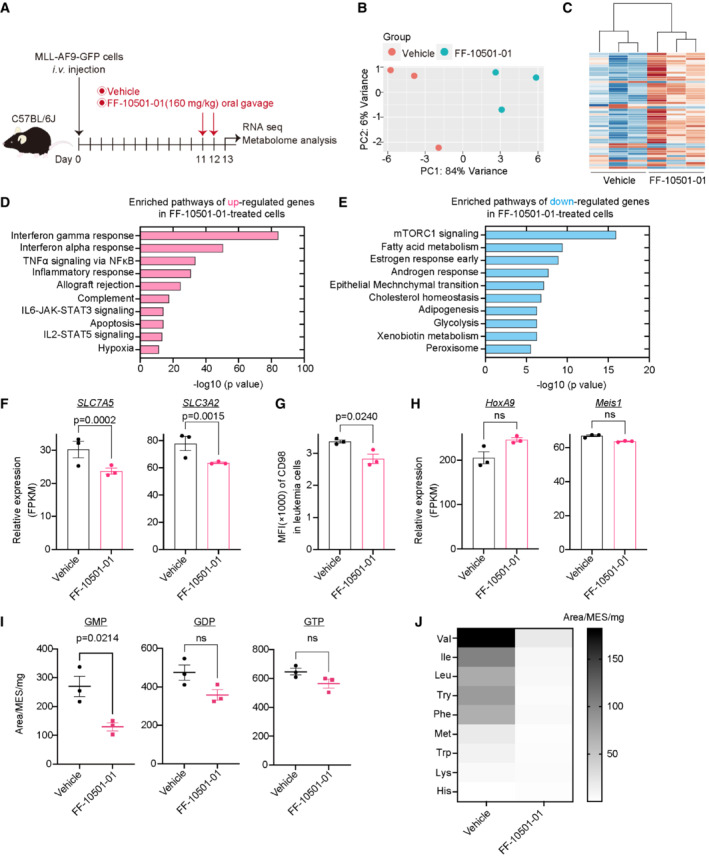
Figure 4. The effect of IMPDH inhibition on gene expression and metabolic profiles.

-
AExperimental scheme used in (B‐J). C57BL/6J mice were transplanted with MLL‐AF9‐GFP cells and were treated with vehicle or FF‐10501‐01 on day 11 and 12. GFP+ MLL‐AF9 leukemia cells collected from mice were used for RNA‐seq and metabolome analysis at day 13.
-
B, CPrincipal Component Analysis (B) and hierarchical clustering (C) of RNA‐Seq data. n = 3 per group.
-
D, EGSEA for up‐ (D) and down‐ (E) regulated genes in FF‐10501‐01‐treated MLL‐AF9 cells using the Hallmark collections of the GSEA MSigDB (http://software.broadinstitute.org/gsea/msigdb). The x‐axis shows the P‐value (−log10).
-
FmRNA expression (FPKM) of SLC7A5 and SLC3A2 in vehicle‐ or FF‐10501‐01‐treated leukemia cells. The P‐value was calculated by Cuffdiff. n = 3 (biological replicates) for each group.
-
GMFI of CD98 on the vehicle‐ or FF‐10501‐01‐treated leukemia cells in mice. A two‐tailed unpaired t‐test was used for the comparison. n = 3 (biological replicates) for each group.
-
HmRNA expression (FPKM) of HoxA9 and Meis1 in vehicle‐ or FF‐10501‐01‐treated leukemic cells. P‐value was calculated by Cuffdiff. n = 3 (biological replicates) for each group.
-
I, JVehicle‐ or FF‐10501‐01‐treated leukemic cells were used for metabolome analyses. n = 3 (biological replicates) per group. Levels of guanine nucleotides (GMP, GDP, and GTP) (I) and amino acid contents (J) are shown. Data are presented as mean ± SEM (I) or as a viridis heatmap (Plot is SEM) (J). A two‐tailed unpaired t‐test was used for the comparison.
Data information: All data are shown as mean ± SEM.
