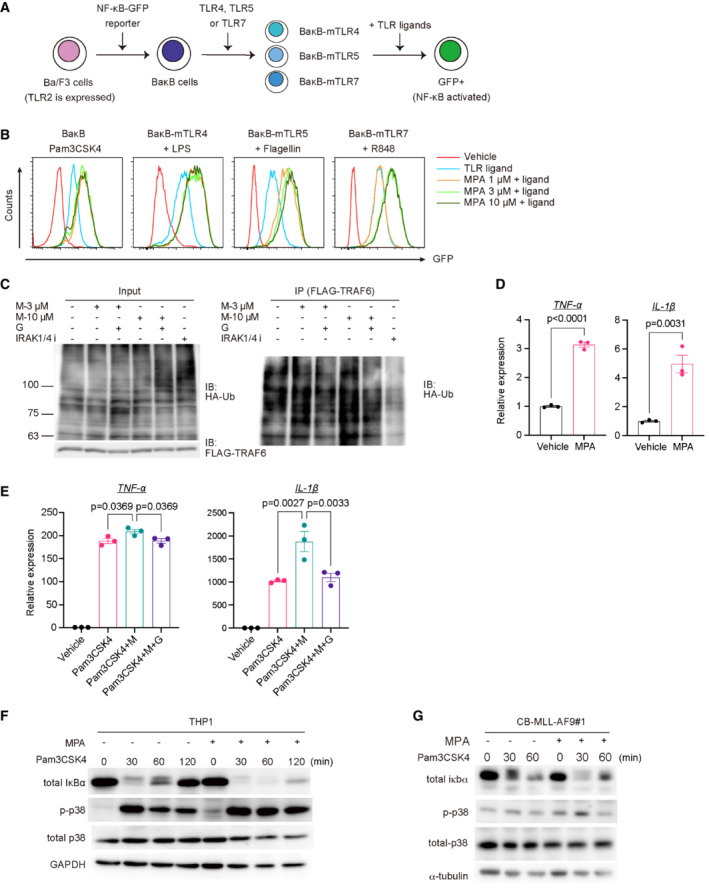
Figure 5. IMPDH inhibition leads to overactivation of the TLR‐TRAF6‐NF‐κB pathway.

-
AExperimental scheme used in (B). Ba/F3 cells were transduced with NF‐κB‐GFP reporter and were then transduced with individual mouse TLR4, TLR5, or TLR7 to establish BaκB cells expressing each TLR. TLR2 is expressed in parent Ba/F3 cells.
-
BThe TLR‐expressing BaκB cells were stimulated with the corresponding TLR ligands (100 ng/ml Pam3CSK4 for TLR2, 100 ng/ml LPS for TLR4, 10 ng/ml Flagellin for TLR5, 100 ng/ml R848 for TLR7) with titrating doses of MPA (1–10 μM). GFP expression was assessed 24 h after the stimulation.
-
C293 T cells were transfected with FLAG‐tagged TRAF6 and HA‐tagged K63‐ubiquitin. After 24 h, these cells were treated with 3 or 10 μM MPA (M‐3 μM or M‐10 μM) with/without 100 μM guanosine (G). IRAK1/4 inhibitor (IRAK1/4 i) was also used as a control. Whole‐cell extracts were immunoprecipitated with anti‐FLAG antibody, and ubiquitinated TRAF6 was detected with anti‐HA antibody.
-
D, EMurine bone marrow‐derived macrophages (BMDMs) were treated with vehicle, 10 μM MPA alone (D) or co‐treated with vehicle, 10 μM MPA (M), 100 ng/ml Pam3CSK4 and 100 μM Guanosine (G) for 4 h (E), as indicated. N = 3 (technical replicates) per group. mRNA levels of TNF‐α and IL‐1β were measured by qPCR. Two‐tailed unpaired t‐tests were used for the comparison in (D). Ordinary one‐way ANOVA was used for the comparison in (E).
-
F, G(F) THP1 cells and (G) MLL‐AF9‐expressing CB cells (CB‐MLL‐AF9#1) were pretreated with 10 μM MPA for 2 h and then treated with 1,000 ng/ml Pam3CSK4 for 0, 30, 60, and 120 min. Cells were lysed and subjected to SDS/PAGE. Levels of total IκBα, phosphate‐p38, total p38, and GAPDH were evaluated by western blotting.
Data information: All data are shown as mean ± SEM.
Source data are available online for this figure.
