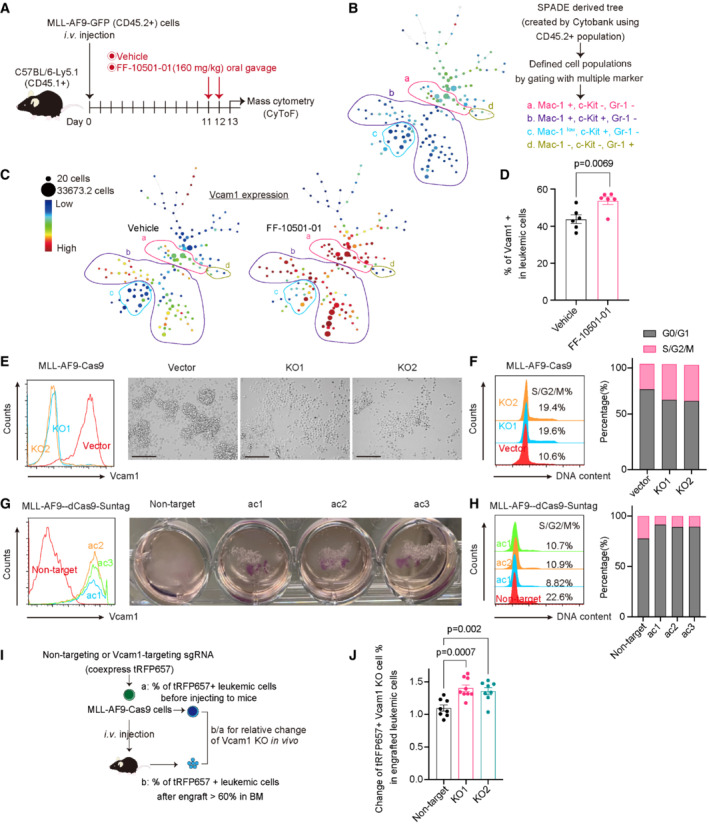
Figure 6. Vcam1 regulates cell–cell interaction and inhibits proliferation in MLL‐AF9 cells.

- Experimental scheme used in (B and C). CD45.2+ MLL‐AF9 cells were collected from CD45.1+ recipient mice treated with the vehicle‐ (n = 4) or FF‐10501‐01 (n = 4) and were subjected to mass cytometry analysis.
- CD45.2+ fraction was used for SPADE analysis in Cytobank (https://premium.cytobank.org/cytobank/login). The SPADE trees show each marker's median expression(From the red to the blue color indicated high to low expression). The size of the node is proportional to the size of the cell population (Min is 20, Max is 33627.3 cell). Several distinct cell populations (a, b, c, d) are highlighted according to the expression of Mac‐1, c‐Kit, and Gr‐1.
- Vcam1 expression in vehicle or FF‐10501‐01‐treated cells is shown.
- Frequencies of Vcam1+ cells in MLL‐AF9 cells collected from the vehicle (n = 6) or FF‐10501‐01(n = 6) treated mice were assessed by FCM. Two‐tailed unpaired t‐test was used for the comparison.
- Left: levels of Vcam1 expression in MLL‐AF9‐Cas9 cells transduced with vector or two independent Vcam1‐targeting sgRNAs (KO1 and KO2). Right: the appearance of cells under microscope's bright field in suspension cultures. (Scale bar: 125 μm).
- Cell cycle status of control and Vcam1‐depleted MLL‐AF9 cells. Left: representative histograms. Right: bar graphs showing the ratio of G0/G1‐ and S/G2/M‐phase cells are shown.
- Left: levels of Vcam1 expression in MLL‐AF9‐dCas9‐SunTag cells transduced with non‐target or sgRNAs targeting Vcam1 promoter regions (ac1, ac2, ac3). Right: the appearance of cells under visual field in suspension cultures in the 12 well plates.
- Cell cycle status of control and Vcam1‐ overexpressed MLL‐AF9 cells. Left: representative histograms. Right: bar graphs showing the ratio of G0/G1‐ and S/G2/M‐phase cells are shown.
- Experimental scheme used in (J). MLL‐AF9‐Cas9 cells were transduced with non‐target and Vcam1‐targeting sgRNAs (tRFP657+) following transplantation into recipient mice.
- Relative ratios of the change of tRFP657+ (sgRNA‐transduced) fraction in GFP+ MLL‐AF9 leukemia cells before and after transplantation are shown. Ordinary one‐way ANOVA was used for the comparison. n = 8 for Non‐target, n = 9 for vcam1‐KO1, n = 8 for vcam1‐KO2. Biological replicates.
Data information: All data are shown as mean ± SEM.
