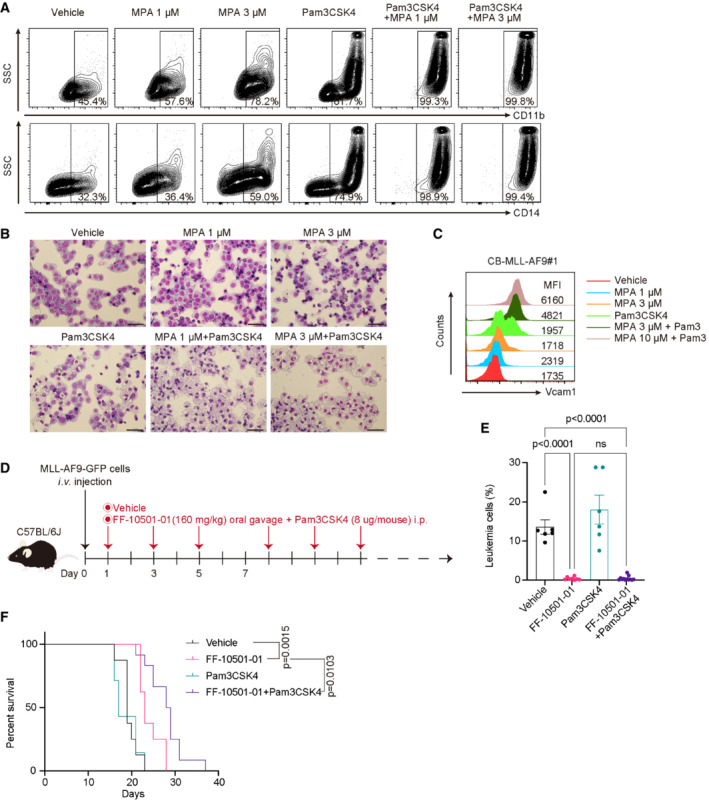
Figure 7. Co‐treatment with MPA and Pam3CDK4 induces differentiation of AML cells.

-
A–CMLL‐AF9‐expressing cord blood cells (CB‐MLL‐AF9#1) were treated with vehicle, 100 ng/ml Pam3CSK4, and 1 or 3 μM MPA for 72 h. (A) Levels of CD11b and CD14, (B) Wright‐Giemsa staining of (A) (Scale bar: 50 μm), and (C) Vcam1 expression in the CB‐MLL‐AF9#1 were assessed. The numbers shown in (A) indicate the frequency of CD11b+ or CD14+ cells. The numbers shown in (C) are Median Fluorescence Intensity (MFI) of Vcam1.
-
DExperimental scheme used in (E and F). C57BL/6J were transplanted with 1 × 10⁵ MLL‐AF9 cells and were then treated with vehicle, FF‐10501‐01(160 mg/kg, oral), Pam3CSK4 (8 μg/mouse, i.p.) or FF‐10501‐01 + Pam3CSK4 from day 3. Drugs were given to mice every other day.
-
EFrequencies of GFP+ leukemic cells in peripheral blood at day 16 or day 20 are shown. Vehicle: n = 7 mice/group; FF‐10501‐01 only: n = 8; Pam3CSK4 only: n = 7; FF‐10501‐01 + PamCSK4: n = 12. Data are shown as mean ± SEM from 2 independent experiments. Ordinary one‐way ANOVA was used for the comparison.
-
FKaplan–Meier survival curves of MLL‐AF9 leukemia mice treated with vehicle (n = 8), FF‐10501‐01 (n = 8), Pam3CSK4 (n = 7) or FF‐10501‐01 + Pam3CSK4 (n = 12). Statistical significance was calculated by the log‐rank test.
Data information: All data are shown as mean ± SEM.
