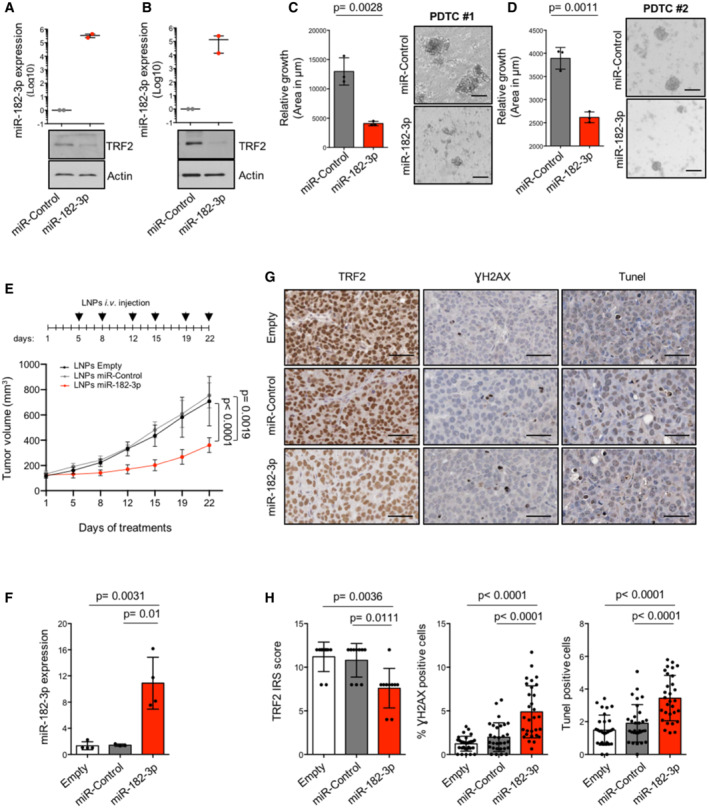
Figure 6. miR‐182‐3p impairs tumor growth by targeting TRF2 in PDTX‐derived tumor cells (PDTCs) and patient‐derived tumor xenografts (PDTXs).

-
A, BPDTCs #1 and #2 underwent two rounds of transfection with miR‐Control or miR‐182‐3p. Three days after the second transfection, miR‐182‐3p and TRF2 expression were analyzed by TaqMan qPCR and western blotting, respectively. Actin was used as loading control.
-
C, DLeft panel, area of each PDTCs was measured by ImageJ. Right panel, representative images are shown. Scale bar: 50 μm. At least 85 3D cells were analyzed for each experimental condition.
-
ENSG mice implanted with breast PDTX (#2) were treated with LNPs‐empty, LNPs‐miR‐Control or LNPs‐miR‐182‐3p as indicated in the scheduling. Caliper measurement of tumors was taken at the indicated days. The mean of tumor volumes (n = 5 per group) is shown.
-
FmiR‐182‐3p expression of tumors from mice treated in (E) was assayed by TaqMan qPCR.
-
GRepresentative images of IHC analysis of the indicated markers from tumors of the experiment showed in (E). Scale bar: 50 μm.
-
HThe histograms show the expression levels of TRF2 measured as immunoreactivity score (IRS), the percentage of positive cells to γH2AX and TUNEL. The analysis was performed on three mice per group, the points represent the number of field analyzed for each condition.
Data information: For (A–F) and (H), data are shown as mean ± SD. For (A–F), P values are determined by unpaired two‐tailed t‐test; for (H), P values are determined by Mann–Whitney t‐test. For the experiments showed in (A, B) and (C, D) two or three biological replicates were performed, respectively.
Source data are available online for this figure.
