
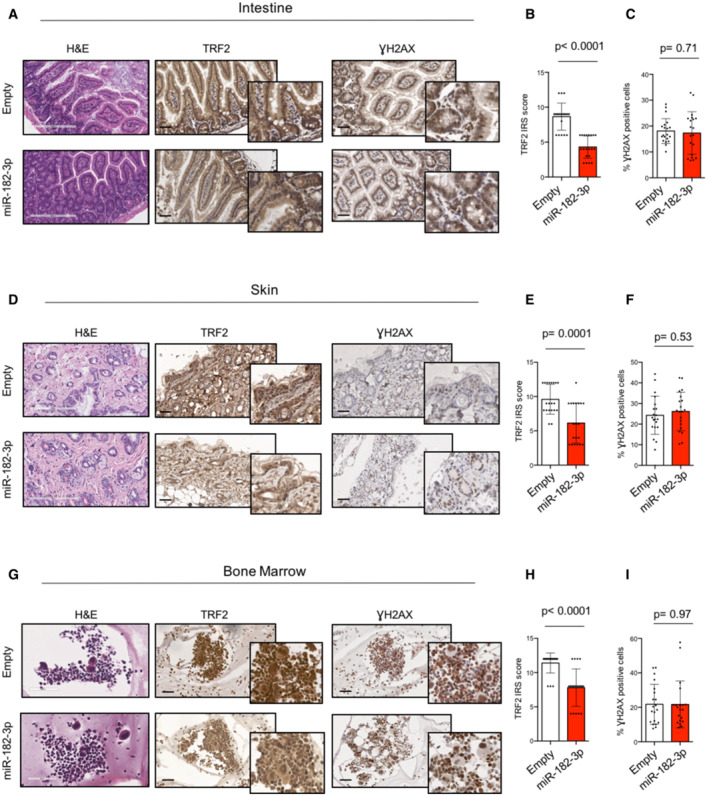
Figure 7. LNPs‐miR‐182‐3p treatment does not cause toxicity or DNA damage in proliferative organs.
-
ARepresentative images of intestine sections from mice previously treated with LNPs‐Empty or LNPs‐miR‐182‐3p. H&E staining (scale bar: 200 μm) and IHC analysis with TRF2 or γH2AX antibodies are shown (scale bar: 50 μm).
-
B, CQuantification of TRF2 expression as immunoreactivity score (IRS) (B) and of γH2AX‐positive cells (%) (C) on intestine samples.
-
DRepresentative H&E (scale bar: 200 μm), TRF2 and γH2AX images of skin samples corresponding to LNPs‐Empty or LNPs‐miR‐182‐3p treated animals (scale bar: 50 μm).
-
E, FQuantification of TRF2 expression as immunoreactivity score (IRS) (E) and of γH2AX‐positive cells (%) (F) on skin samples.
-
GRepresentative H&E (scale bar: 200 μm), TRF2 and γH2AX images of bone marrow samples corresponding to LNPs‐Empty or LNPs‐miR‐182‐3p treated animals (scale bar: 50 μm).
-
H, IQuantification of TRF2 expression as immunoreactivity score (IRS) (H) and of γH2AX‐positive cells (%) (I) on bone marrow samples.
Data information: For (B, C, E, F, H, I), data are shown as mean ± SD. A Mann–Whitney test t‐test was used to calculate statistical significance. Four mice per group were analyzed, the points represent the number of field analyzed for each condition.
Source data are available online for this figure.