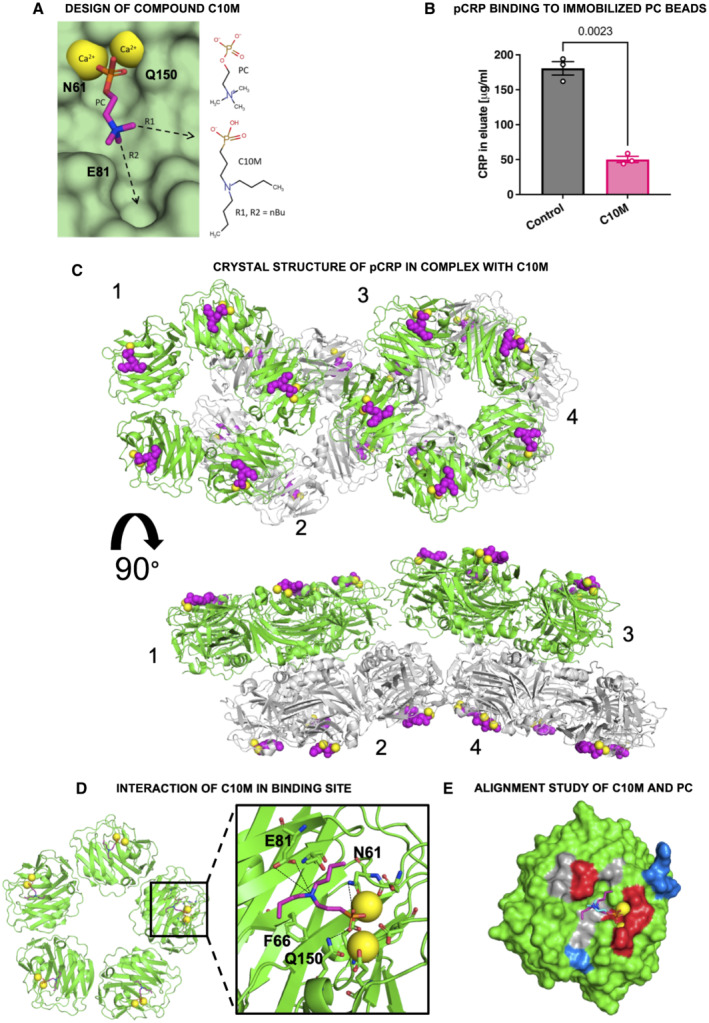
Figure 1. Binding studies of tool compound C10M to pCRP in vitro .

- Design of the phosphonate compound C10M was guided by the PC:pCRP complex (PDB ID: 1B09), with two n‐butyl substituents (nBu) on the tertiary amine exploiting available space in the binding pocket along the denoted vectors R1 and R2. Calcium cations shown as yellow spheres and the location of pCRP residues Asn 61 (N61), Glu 81 (E81), and Gln 150 (Q150) are indicated. pCRP depicted as a light green molecular surface.
- C10M reduces binding of pCRP to immobilized PC. pCRP was incubated with p‐aminophenyl phosphoryl choline agarose beads under binding conditions with and without C10M. Porous solid column chromatography was then used to evaluate the binding capacity of pCRP to PC. Biological replicates, n = 3, mean ± SEM. P value was calculated with Student's t‐test.
- The crystal structure of pCRP (shown as cartoon) in complex with C10M (pink spheres) confirmed that the compound binds to the same pocket as PC/PE. The asymmetric unit consisted of four stacked pCRP pentamers; two pairs of pentamers, 1 & 2 and 3 & 4, are stacked A‐face to A‐face. Pentamers 2 and 4 are colored gray to show their relative location to pentamers 1 and 3 (colored green). C10M was bound to all CRP monomeric subunits (Fig EV1; Tables EV1 and EV2). Each CRP monomeric subunit contained two calcium cations (depicted as yellow spheres). Orthogonal views of the asymmetric unit are shown.
- Structure of one pentamer from the asymmetric unit. Interaction of the phosphonate moiety with the bound calcium cations (yellow spheres) and hydrogen bonds with Asn 61 (N61), Glu 81 (E81), and Gln 150 (Q150) (black dashed lines) anchor the compound in the binding pocket. Full list of interacting residues is given in Table EV1.
- Alignment of C10M (pink/blue/red/orange sticks) and PC (cyan/blue/red/orange sticks) in complex with pCRP via the Cα atoms of pCRP. One monomeric subunit of pCRP is depicted as a molecular surface, the location of acidic (red), basic (blue) and hydrophobic (gray) residues around the PC binding pocket is indicated. Calcium cations shown as yellow spheres.
Source data are available online for this figure.
