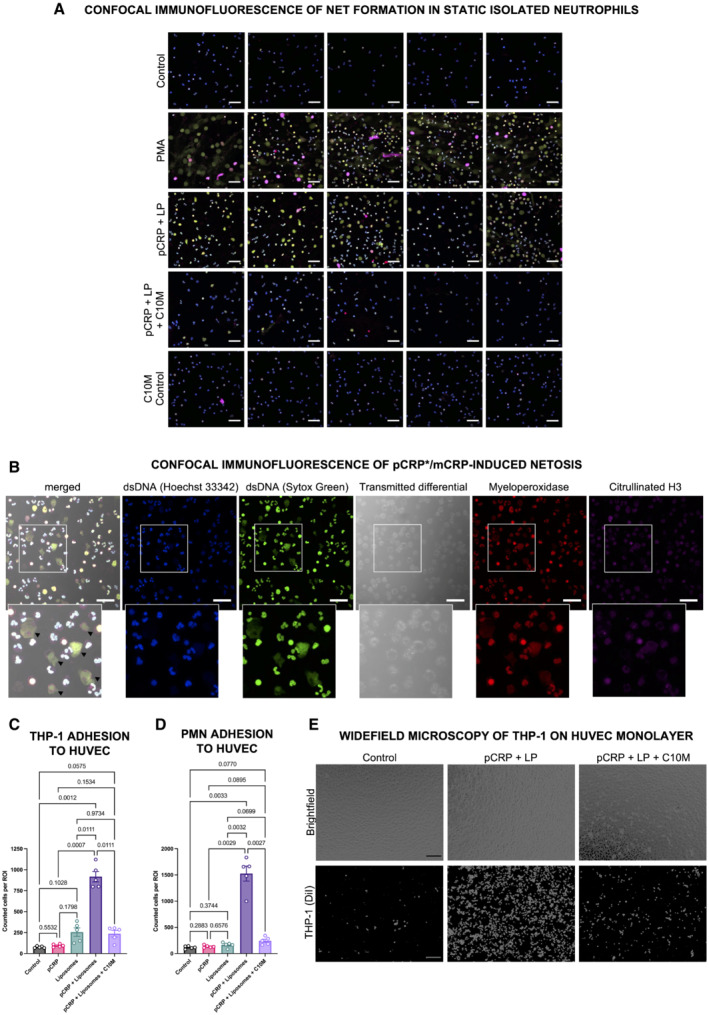
Figure EV2. Inhibitory effects of C10M on pCRP*/mCRP‐induced NETosis and leukocyte–endothelial interaction.

-
ARepresentative confocal immunofluorescence images of isolated human neutrophils as summarized in Fig 4H. Cells were stained with anti‐dsDNA dyes Hoechst 33342 and Sytox Green, and anti‐MPO and anti‐citH3 antibodies. Shown are uncropped images of merged channels and at 40× magnification. Scale bars indicate 50 μm.
-
BRepresentative single‐channel confocal immunofluorescence images of pCRP*/mCRP‐induced NETosis. Cells demonstrating NETs in the pCRP*/mCRP‐stimulated group showed disrupted cell membranes as visible in the transmitted differential and merged channel (black arrow heads), indicating a suicidal mode of NETosis. Scale bars indicate 50 μm.
-
C–ELeukocyte adhesion on endothelial cells. HUVEC monolayers treated with different isoforms of CRP as described for Fig 4B and C were incubated with fluorescently‐labeled THP‐1 cells (C, E) and neutrophils isolated from human whole blood (PMN, D) for 30 min. After incubation, the monolayer was washed and adherent cells were fixed. THP‐1 cell and neutrophil binding to HUVEC monolayers were then evaluated by automated cell counting in five non‐overlapping ROIs at 10× magnification as demonstrated for THP‐1 in (E). Scale bars indicate 100 μm. Graph shows mean ± SEM. P values were calculated with ANOVA and Tukey's post‐hoc test. Biological replicates, n = 5 for THP‐1 and PMN, respectively.
Source data are available online for this figure.
