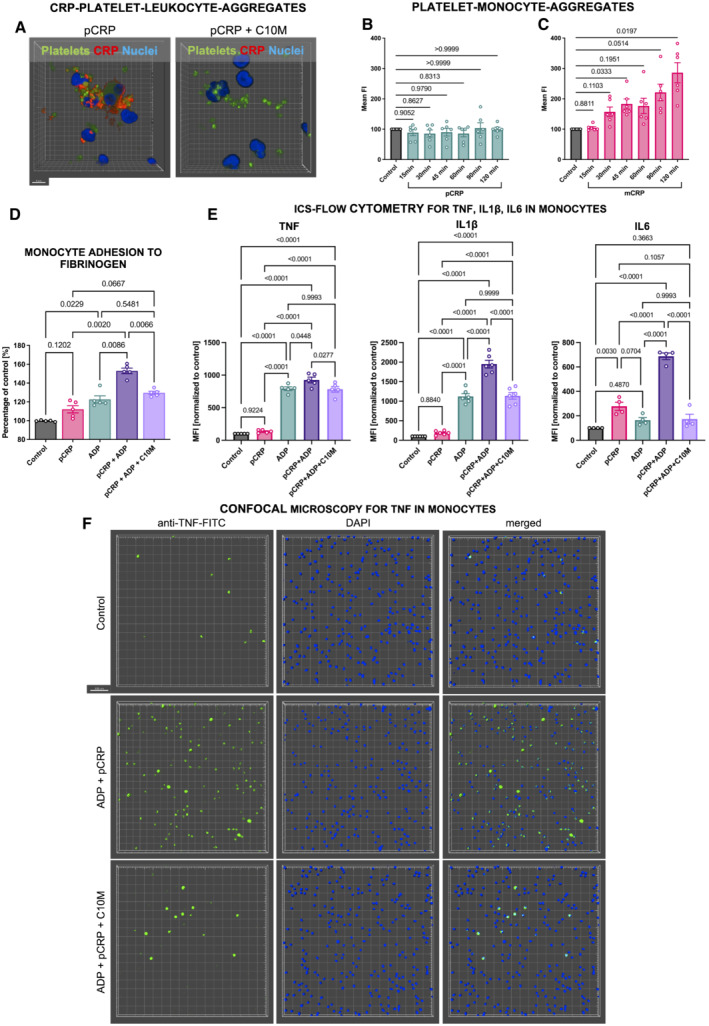
Figure 3. Studies on CRP‐dependent expression of pro‐inflammatory cytokines and inhibiting effects of C10M.

-
ACRP‐coated platelets visualized by confocal microscopy bound to whole blood leukocytes. Washed platelets (green) were incubated in serum supplemented with 50 μg/ml pCRP‐Atto 594 (red), without (left) and with C10M (right, 1:100 molar ratio). Platelets were then added to whole blood samples and imaged after RBC lysis. Shown are platelet–leukocyte aggregates with and without CRP attached. Scale bar indicates 5 μm.
-
B, CCRP induces platelet–leukocyte aggregation in a time‐dependent and conformation‐specific manner. Whole blood samples stimulated with either 50 μg/ml pCRP (B) or mCRP (C) were analyzed by flow cytometry. Double positive events (CD62P and CD14) were identified as platelet–monocyte complexes. Incubation was stopped at indicated time points. Displayed are mean ± SEM. P values were calculated with ANOVA and Tukey's post hoc test. Biological replicates, n = 6.
-
DStatic adhesion of monocytes to 20 μg/ml fibrinogen was tested as described before. Purified monocytes (3 × 10⁶ per ml) were stimulated with 50 μg/ml pCRP and 20 μM ADP and allowed to adhere for 35 min. ADP was used to activate supplemented platelets. Monocyte adhesion was quantified by calorimetric method and absorbance measured after 30 min. Results are shown as mean ± SEM. P values were calculated using ANOVA and Tukey's post hoc test. Biological replicates, n = 5.
-
EExpression of TNF, IL1β and IL6 (from left to right) in monocytes analyzed by flow cytometry. The addition of C10M to the whole blood samples inhibits the CRP‐dependent expression of pro‐inflammatory cytokines. P values were calculated with ANOVA and Tukey's post‐hoc test. Biological replicates, n = 6 (IL6), n = 5 (TNF) and n = 4 (IL1β), respectively, bars indicate mean ± SEM.
-
FRepresentative examples of whole blood samples treated with pCRP and C10M visualized by confocal fluorescence microscopy. Depicted are 3D reconstructions multiple focal planes at 20× magnification. The leukocytes were stained with DAPI (blue) and anti‐TNF‐FITC (green). Scale bar 50 μm.
Source data are available online for this figure.
