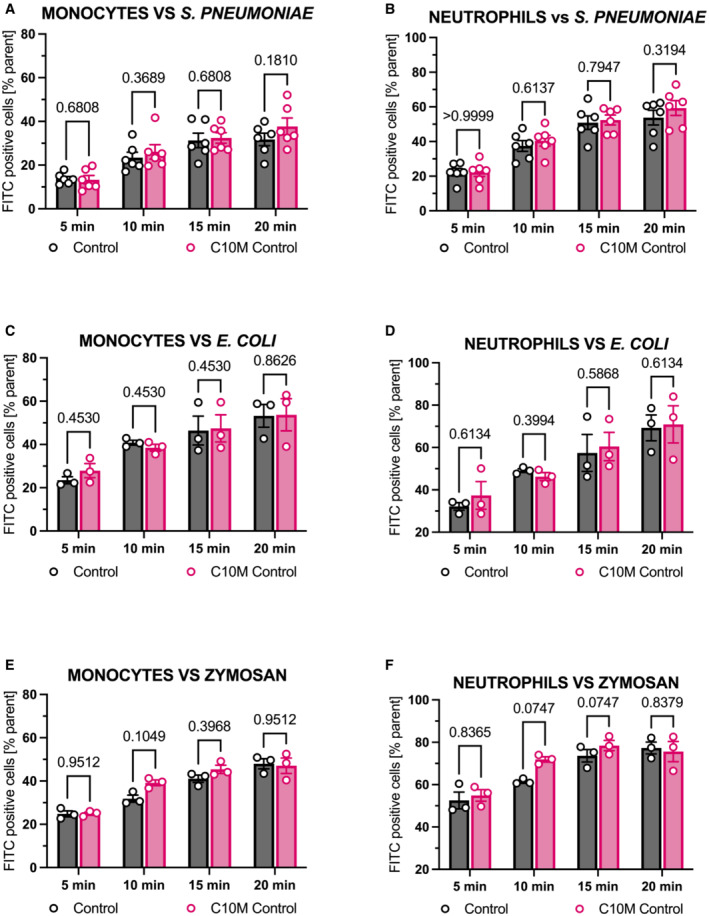
Figure EV3. Flow cytometry‐based analysis of phagocytosis of S. pneumoniae, E. coli, and zymosan in the presence and the absence of C10M.

-
A, BPhagocytosis of heat‐killed and FITC‐labeled S. pneumoniae by monocytes (A) and neutrophils (B) was analyzed with or without C10M (in equal concentrations used as demonstrated in Fig 7). Bar chart shows phagocytic index (percentage of target positive cells of subtype/all cells of subtype) of an untreated control versus C10M treated cells after 5, 10, 15, and 20 min, respectively. Mean ± SEM are indicated.
-
C, DPhagocytosis assay for heat‐killed and FITC‐labeled E. coli by monocytes (C) and neutrophils (D).
-
E, FPhagocytosis of the yeast cell wall ligand zymosan (Saccharomyces cerevisiae) by monocytes (E) and neutrophils (F). Mean ± SEM are indicated.
Data information: Statistical analysis for all assays shown was performed using multiple matched t‐tests. Biological replicates, n = 3 and 6. Precise P‐values are given.
Source data are available online for this figure.
