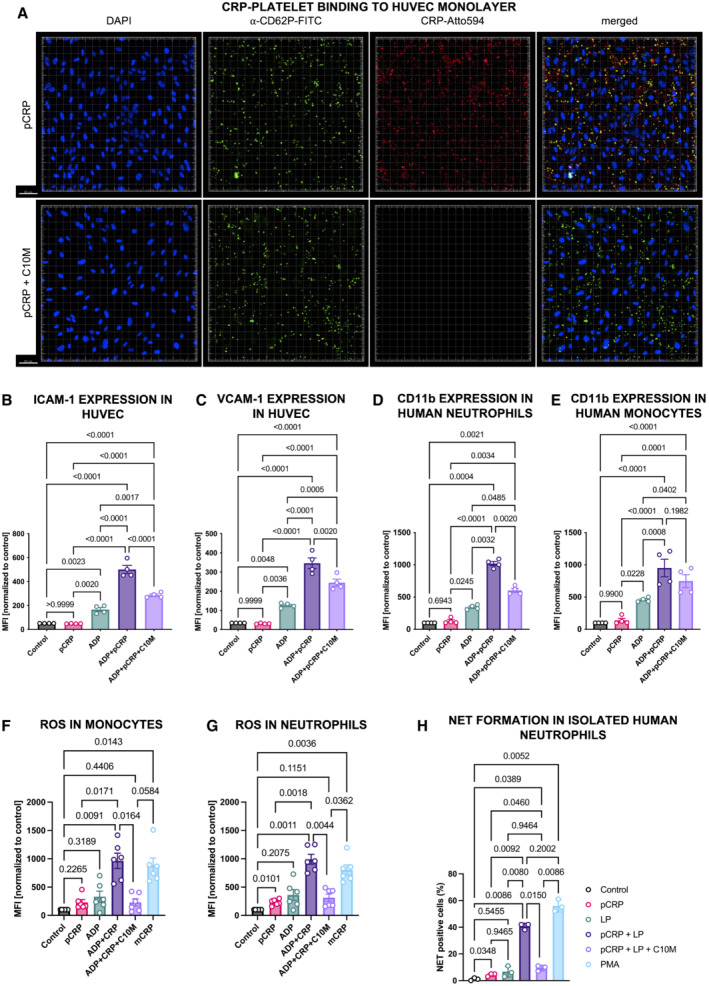
Figure 4. pCRP binding to ADP‐activated platelets is inhibited by C10M, reducing expression of adhesion molecules involved in leukocyte diapedesis in endothelial cells and leukocytes, ROS formation, and NET formation.

-
AConfocal fluorescence microscopy of ADP‐activated platelets bound to HUVEC mono cell layers. pCRP‐Atto 594 (depicted in red) was added and incubated with and without C10M. Anti‐CD62P‐FITC antibody was used to detect the platelets (green). HUVEC nuclei were counterstained with DAPI (blue). pCRP colocalizes with platelets on the endothelial cells. C10M inhibits CRP binding to activated platelets. Scale bar 50 μm.
-
B, CQuantification of ICAM‐1 (B) and VCAM‐1 (C) expression on pCRP*/mCRP‐activated HUVECs. ICAM‐1 and VCAM‐1 expressions were measured by flow cytometry. ADP‐stimulated platelets were added to each sample (except for “Control” and “pCRP”) and served as activated cell membranes for pCRP dissociation to pCRP*/mCRP. C10M inhibits the generation of pCRP*/mCRP, thereby reducing the expression of ICAM‐1 and VCAM‐1. Mean fluorescence intensity (MFI) results in flow cytometry are shown with results normalized to control, mean ± SEM. P values were calculated with ANOVA and Tukey's post‐hoc test. Biological replicates, n = 4.
-
D, EExpression of integrin subunit αM (CD11b) in neutrophils (D) and CD14+ monocytes (E) was accessed by flow cytometry as described previously (Kiefer et al, 2021). Human whole blood was incubated with 25 μg/ml pCRP, 20 μM ADP, and C10M (molar ratio 1:100, pCRP:C10M), respectively. CD11b expression was analyzed by flow cytometry in neutrophils (CD16+, SSC high) and monocytes (CD14+, SSC low). Shown are scatter plots of MFI results in flow cytometry with results normalized to control, mean ± SEM. P values were calculated with ANOVA and Tukey's post‐hoc test. Biological replicates, n = 4.
-
F, GROS generation in whole blood detected in CD14+ monocytes (F) and neutrophils (G) by redox‐indicator dihydroethidium (DHE; 10 μg/ml). Blood samples incubated for 3 h at 37°C, 5% CO2 with 50 μg/ml pCRP and mCRP, 20 μM ADP and C10M (molar ratio 1:100, pCRP:C10M), respectively. Control was left unstimulated and mCRP served as a positive control (Thiele et al, 2018). Cells were washed after red blood cell lysis and analyzed by flow cytometry. Shown are MFI results with results normalized to control, mean ± SEM. P values were calculated with ANOVA and Tukey's post‐hoc test. Biological replicates, n = 6.
-
HpCRP*/mCRP dependent NETosis in isolated human neutrophils detected by confocal immunofluorescence microscopy. Isolated neutrophils incubated for 3 h at 37°C, 5% CO2 with 100 μg/ml pCRP with and without PC:LPC liposomes (LP) and C10M (molar ratio 1:100, pCRP:C10M), respectively. Control was left unstimulated and 100 nM phorbol 12‐myristate 13‐acetate (PMA) served as a positive control. Cells were washed, fixed, and stained, and analyzed by confocal microscopy. Results are given as a ratio of NETing cells/all cells per ROI, with mean ± SEM. P values were calculated with ANOVA and Tukey's post‐hoc test. Biological replicates, n = 3.
Source data are available online for this figure.
