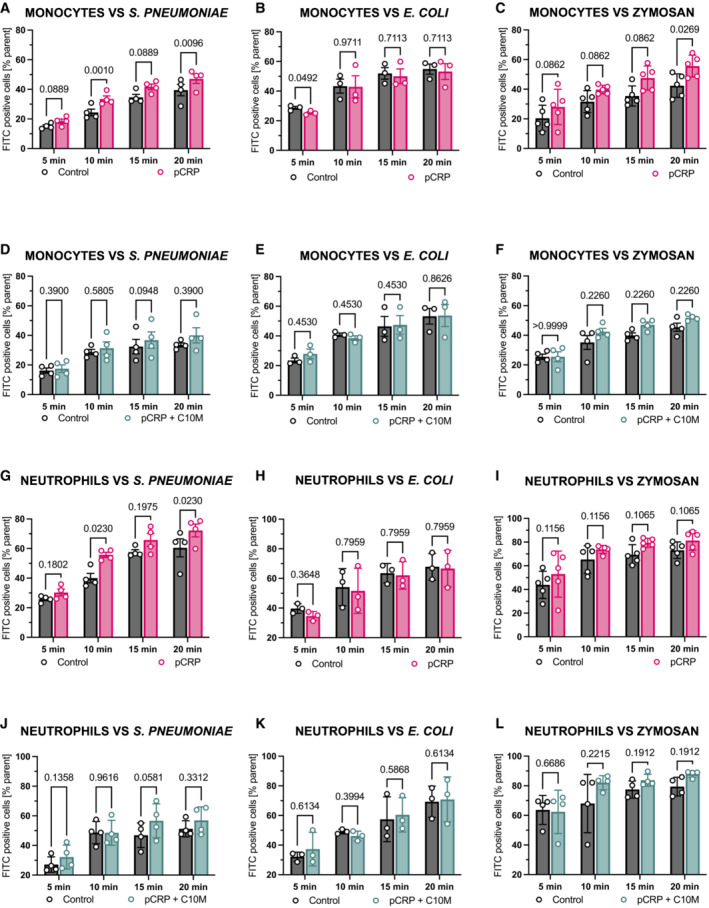
Figure 7. Flow cytometry‐based analysis of CRP‐dependent opsono‐phagocytosis of S. pneumoniae, E. coli, and zymosan in the presence of C10M.

- Phagocytosis of pCRP‐opsonized, heat‐killed and FITC‐labeled S. pneumoniae by human monocytes serves as an exemplary flow cytometry‐based phagocytosis assay. Bar chart shows phagocytic index (percentage of target positive cells of subtype/all cells of subtype) of un‐opsonized (control, dark gray) and pCRP‐opsonized targets (red) after 5, 10, 15, and 20 min, respectively.
- Phagocytosis of pCRP‐opsonized, heat‐killed and FITC‐labeled E. coli by human monocytes serves as a second exemplary flow cytometry‐based phagocytosis assay. Bar chart shows phagocytic index as described above of un‐opsonized (control, dark gray) and pCRP‐opsonized targets (red) after 5, 10, 15, and 20 min, respectively.
- Phagocytosis of pCRP‐opsonized, heat‐treated, and FITC‐labeled zymosan by human monocytes serves as a third exemplary flow cytometry‐based phagocytosis assay. Bar chart shows phagocytic index as described above of un‐opsonized (control, dark gray) and CRP‐opsonized targets (red) after 5, 10, 15, and 20 min, respectively.
- Experiments described in (A) were repeated but with targets incubated with pCRP (100 μg/ml) and C10M (1:100 molar ratio) for 30 min, 37°C. Bar chart shows phagocytic index of S. pneumoniae‐positive monocytes for un‐opsonized (control, dark gray) and targets incubated with pCRP and C10M (green) after 5, 10, 15, and 20 min, respectively.
- Experiments described in (B) were repeated but with targets incubated with pCRP (100 μg/ml) and C10M (1:100 molar ratio) for 30 min, 37°C. Bar chart shows phagocytic index of E. coli‐positive monocytes for un‐opsonized (control, dark gray) and targets incubated with pCRP and C10M (green) after 5, 10, 15, and 20 min, respectively.
- Experiments described in (C) were repeated but with targets incubated with pCRP (100 μg/ml) and C10M (1:100 molar ratio) for 30 min, 37°C. Bar chart shows phagocytic index of zymosan‐positive monocytes for un‐opsonized (control, dark gray) and targets incubated with pCRP and C10M (green) after 5, 10, 15, and 20 min, respectively.
- Phagocytosis of pCRP‐opsonized, heat‐killed, and FITC‐labeled S. pneumoniae by human neutrophils. The same blood samples described in (A) were analyzed for the phagocytic index of S. pneumoniae by human neutrophils by flow cytometry. Bar chart shows phagocytic index of un‐opsonized (control, dark gray) and pCRP‐opsonized targets (red) after 5, 10, 15, and 20 min, respectively.
- Phagocytosis of pCRP‐opsonized, heat‐killed, and FITC‐labeled E. coli by human neutrophils. The same blood samples described in (B) were analyzed for the phagocytic index of S. pneumoniae by human neutrophils by flow cytometry. Bar chart shows phagocytic index of un‐opsonized (control, dark gray) and pCRP‐opsonized targets (red) after 5, 10, 15, and 20 min, respectively.
- Phagocytosis of pCRP‐opsonized, heat‐killed, and FITC‐labeled zymosan by human neutrophils. The same blood samples described in (C) were analyzed for the phagocytic index of S. pneumoniae by human neutrophils. Bar chart shows phagocytic index of un‐opsonized (control, dark gray) and pCRP‐opsonized targets (red) after 5, 10, 15, and 20 min, respectively.
- Phagocytosis of pCRP+C10M‐treated S. pneumoniae by human neutrophils. Results from experiments described in (D) were analyzed for the phagocytic index of S. pneumoniae by human neutrophils by flow cytometry. Bar chart shows phagocytic index of S. pneumoniae‐positive neutrophils for un‐opsonized (control, dark gray) and targets incubated with pCRP and C10M (green) after 5, 10, 15, and 20 min, respectively.
- Phagocytosis of pCRP+C10M‐treated E. coli by human neutrophils. Results from experiments described in (E) were analyzed for the phagocytic index of S. pneumoniae by human neutrophils by flow cytometry. Bar chart shows phagocytic index of E. coli‐positive neutrophils for un‐opsonized (control, dark gray) and targets incubated with pCRP and C10M (green) after 5, 10, 15, and 20 min, respectively.
- Phagocytosis of pCRP+C10M‐treated zymosan by human neutrophils. Results from experiments described in (F) were analyzed for the phagocytic index of S. pneumoniae by human neutrophils by flow cytometry. Bar chart shows phagocytic index of zymosan‐positive neutrophils for un‐opsonized (control, dark gray) and targets incubated with pCRP and C10M (green) after 5, 10, 15, and 20 min, respectively.
Data information: Bar graphs with individual experiments (A–L) show mean ± SD of the phagocytic index (percentage of target positive cells of subtype/all cells of subtype) of un‐opsonized (control, dark gray), CRP‐opsonized targets (red), and CRP‐opsonized targets in the presence of C10M after 5, 10, 15, and 20 min, respectively. P values were calculated using multiple matched t‐tests. Biological replicates, n = 3–5. Precise P‐values are given.
Source data are available online for this figure.
