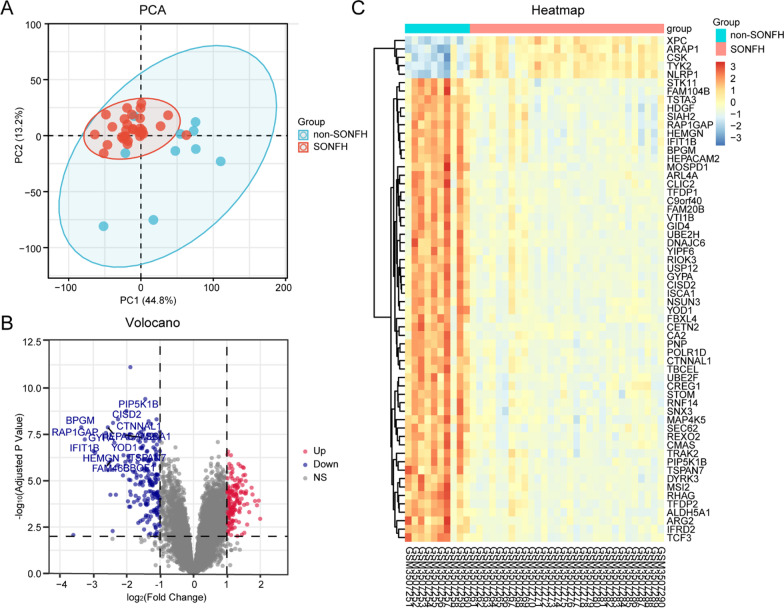
Fig. 1.
Microarray data processing and identification of DEGs of GSE123568 in SONFH samples compared to non-SONFH samples. A PCA of GSE123568 in SONFH samples compared to non-SONFH samples. The blue dot represented non-SONFH samples, and the red dot represented SONFH samples. B Volcano plots of DEGs. Data points in red represent upregulated, and blue represent downregulated genes. The differences were set as |log2FC|> 1 and adjusted P value < 0.01. The text was added directly to the plot by adjusted P value < 0.000001 and |log2FC|> 2. C Hierarchical clustering heatmap of the top 60 DEGs sorted by adjusted P value. Legend on the top right indicates the log2FC

