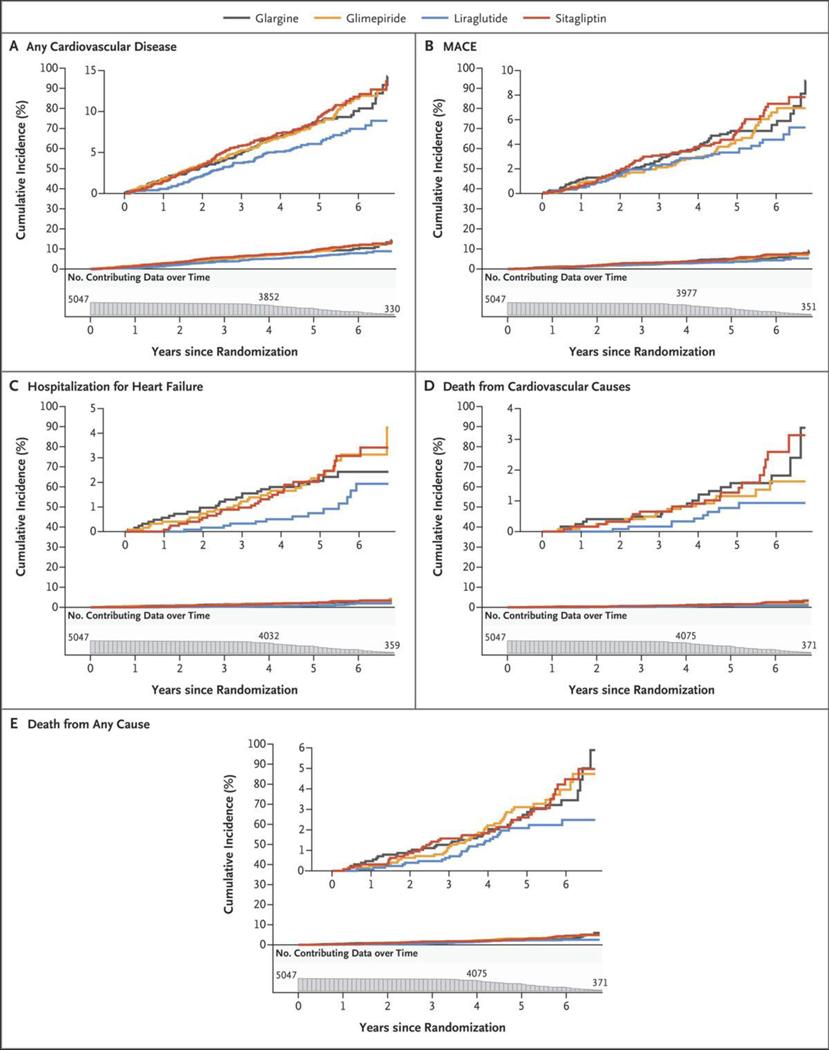
Figure 3. Cumulative Incidences of Cardiovascular Outcomes and Mortality in the Intention-to-Treat Analyses.
Shown are the cumulative incidences of any cardiovascular disease (Panel A), a major adverse cardiovascular event (MACE) (Panel B), hospitalization for heart failure (Panel C), death from cardiovascular causes (Panel D), and death from any cause (Panel E) over 6.5 years of follow-up. The numbers plotted below the x axis of each panel are the participants at risk for the outcome at each follow-up time point (i.e., the number of participants in whom a specified outcome event had not developed by that time).

