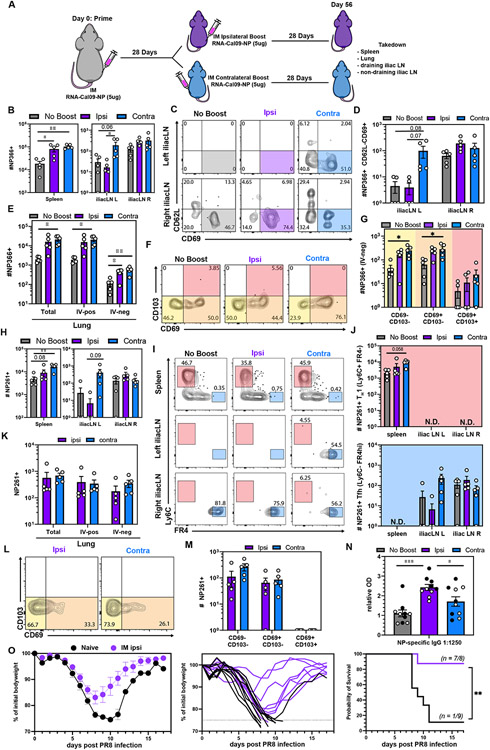
Fig 1. Impact of ipsilateral versus contralateral intramuscular mRNA-vaccination on CD8 T cell, CD4 T cell, and humoral immunity.
(A) Mice were primed in the right hamstring then boosted in either the right (ipsilateral) or left (contralateral) hamstring. ≥28 days post boost, spleen, iliac LN, medLN and lungs were examined. (B) Quantification of antigen-specific CD8+ T cells in the indicated SLOs. (C-D) Representative flow cytometry plot (C) and quantification (D) of NP366-specific CD8+ CD69+CD62L− SLO TRM. (E) Enumeration of antigen-specific CD8+ T cells in the indicated lung compartments. (F-G) Representative flow cytometry plot (F) and quantification (G) of NP366+ CD8 T cell subsets in the lung parenchyma (IV-neg). (H) Enumeration of antigen-specific CD4+ T cells in the indicated SLOs. (I-J) Representative flow cytometry plot (I) and quantification (J) of NP261-specific CD4+ TH1 and TFH in SLOs. (K) Quantification of antigen-specific CD4+T cells in the indicated lung compartments. (L-M) Representative flow cytometry plot (L) and quantification (M) of NP261-specific CD4+ T cell subsets in the lung parenchyma (IV-neg). (N) NP IgG specific serum antibody titers. Open and closed circles represent data from two independent experiments. (O) Ipsilaterally prime-boosted mice were challenged with Influenza A/PR8 IN. Weight relative to initial bodyweight over time (left, middle), and survival (right). Data represent N = 2 independent experiments with n = 4-5 mice per group except for (N-O) where data was pooled from N = 2 independent experiments with n = 8-10 mice. Data are shown as mean ± SEM. *P<0.05, **P<0.01, ***P<0.001, ****P<0.0001 as determined by one-way ANOVA and Tukey’s multiple comparisons test (for 3 groups) or unpaired two-tailed Student’s t test (2 groups) or with log-rank Mantel-Cox test for survival. N.D. = not determined.

