Fig. 4.
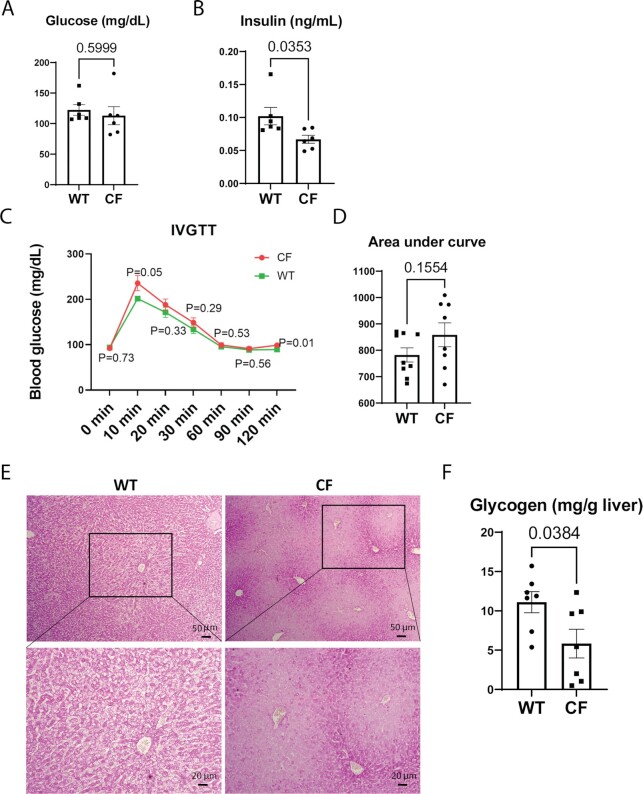
Glucose intolerance in CF rabbits. (A) Levels of fasting blood glucose in CF (n = 6, 41 ± 1 days of age) and WT (n = 6, 38 days of age) rabbits. (B) Levels of fasting insulin of CF (n = 6, 41 ± 1 days of age) and WT (n = 6, 38 days of age) rabbits. (C) Intravenous glucose tolerance test (IVGTT) curves of CF (n = 8, 49 ± 1 days of age) and WT (n = 9, 48 ± 1 days of age) rabbits. P values indicate the statistical differences between CF and WT rabbits at each corresponding timepoint. (D) Area under curve values of the IVGTT curves of CF and WT rabbits. (E) Periodic acid-Schiff (PAS) staining of hepatic glycogens in CF and WT rabbits. Boxes in the upper panels correspond to the higher magnification images in lower panels. Scale bars: 50 μm in the upper panels; 20 μm in the lower panels. (F) Enzymatic assay of hepatic glycogens in CF (n = 7, 43 ± 2 days of age) and WT (n = 7, 41 ± 3 days of age) rabbits.

