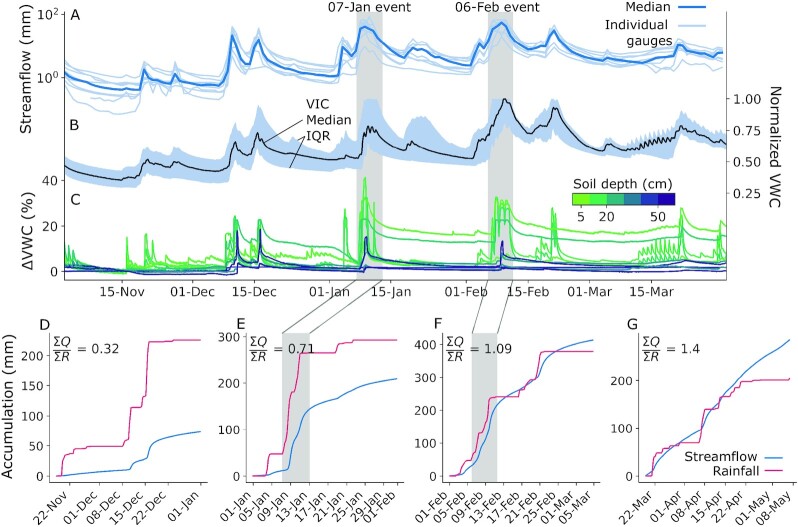
Fig. 6.
Winter (A) observed daily streamflow at nine gauges and (B) modeled soil moisture in our study basins. (C) Departure in observed soil moisture at high-elevation stations (n = 6 above 1,600 m) from values preceding the 16 November 2016 storm. Note that the deep soil moisture at certain stations (e.g., at CSL) became saturated before this period and, therefore, display no change. (D) Streamflow and estimated rainfall (the liquid portion of total precipitation) accumulations at the stream gauge in the central Feather (USGS gauge 11402000). Rainfall values are aggregated from gridded precipitation over the catchment area upstream of the gauge (Fig. 1A).

