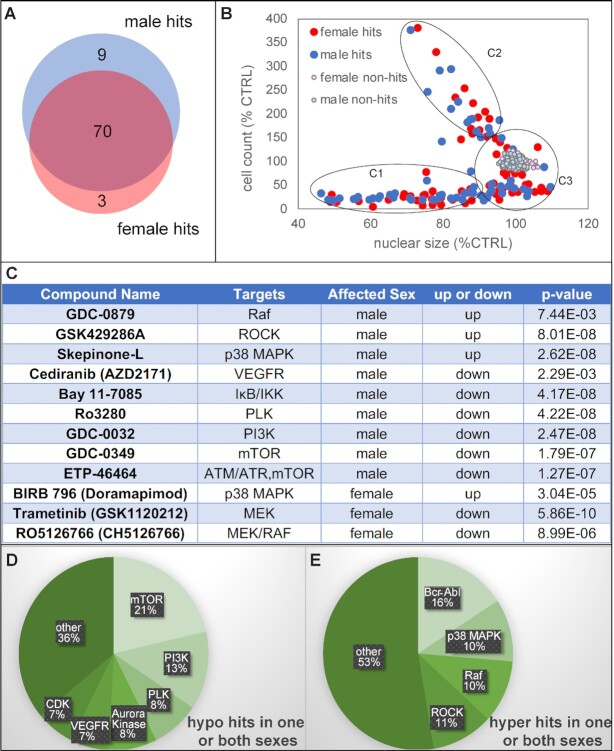
Fig. 2.
Identification of kinase inhibitors that affect GTme growth in vitro. (A) Venn diagram of the 82 hits. (B) Scatterplot of all CPDs on cell count vs. nuclear size categorizing all hits into three groups (C1, C2, and C3). (C) List of hits that exhibited a sex-dimorphic response in GTme proliferation. (D and E) Functional clusters of hypo and hyperhits.

