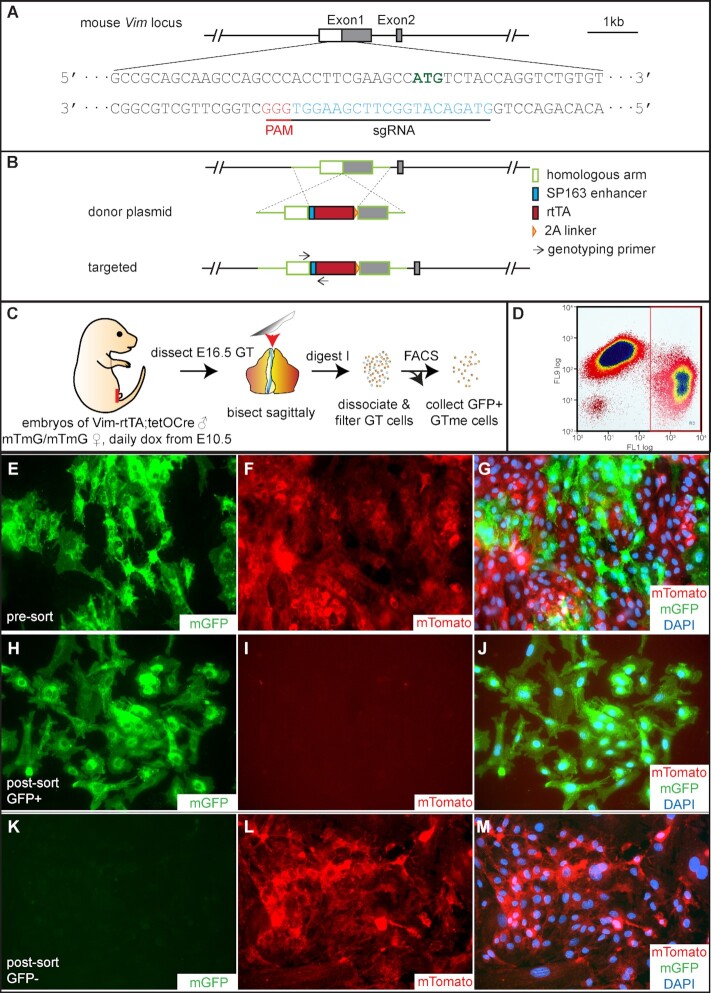
Fig. 3.
Generation of Vim-rtTA mouse and isolation of mTmGVim GTme cells. (A) Location and sequence of sgRNA in relation to the mouse Vim genomic locus. (B) Schematics of donor plasmid design, homologous recombination event, and targeted Vim allele. (C) Schematic illustration of the GTme isolation process from mTmGVim embryos. (D) Representative FACS dot plot showing separation of green GFP+ (FL1) and red Tomato+ (FL9) populations. (E to M) Fluorescence microscopy of GTme cells before (E to G) and after sorting (H to J, gated for GFP; I to M, gated for Tomato). Cells were allowed to attach to cover glass in culture before imaging.

