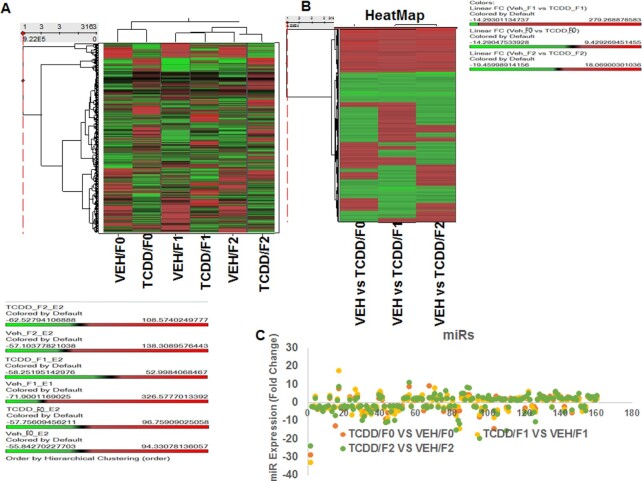
Fig. 2.
Showing analysis of thymic miRs of F0, F1, and F2 generations exposed to VEH or TCDD. Total miRs from groups of five pooled mouse thymi of F0, F1, and F2 generations of control or TCDD groups were analyzed. (A) Heat map depicting miR expression in thymi of VEH- or TCDD-exposed F0, F1, and F2 generations. The spectrum of downregulated to the upregulated expression pattern of miRs expression is shown from green to red. (B) Showing fold change (>1.5) expression profile of miRs of F0, F1, and F2 generations between the two groups (VEH- or TCDD-exposed). (C) Showing upregulation or downregulation (>1.5-fold change) of miRs regulated by TCDD, when compared to miRs of VEH-treated groups.

