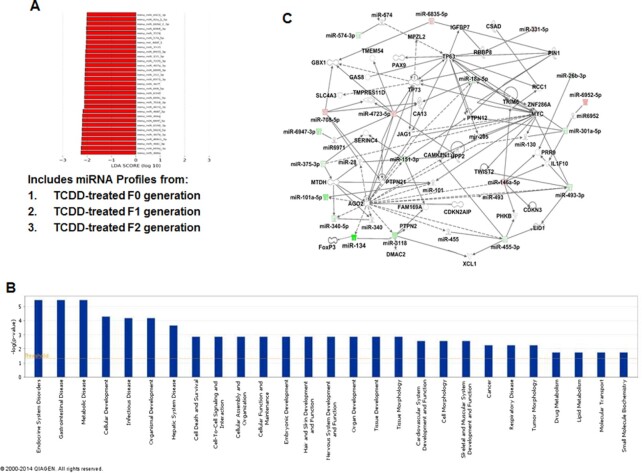
Fig. 3.
Pathway analysis of TCDD-regulated miRs and their association with functional networks. (A) LDA of miRs in the TCDD group. TCDD group included miR profiles from TCDD-treated F0, F1, and F2 generations. LDA analysis, which was set at a threshold of 2.0 led to the identification of 31 miRs as possible biomarkers, unique to the TCDD group. (B) TCDD-mediated changes in miRs by 1.5-fold or higher were analyzed using IPA software and their database. The bars in the graph demonstrate various pathways regulated by TCDD-induced miRs. The –log (P-value) on Y-axis represents the significance of function by random chance (IPA software, Qiagen Inc.). (C) Showing miRs involved in a pathway with various functions. Pink color represents upregulated mature miRs and green color represents downregulated miRs in TCDD vs VEH-treated groups.

