
Figure 1.
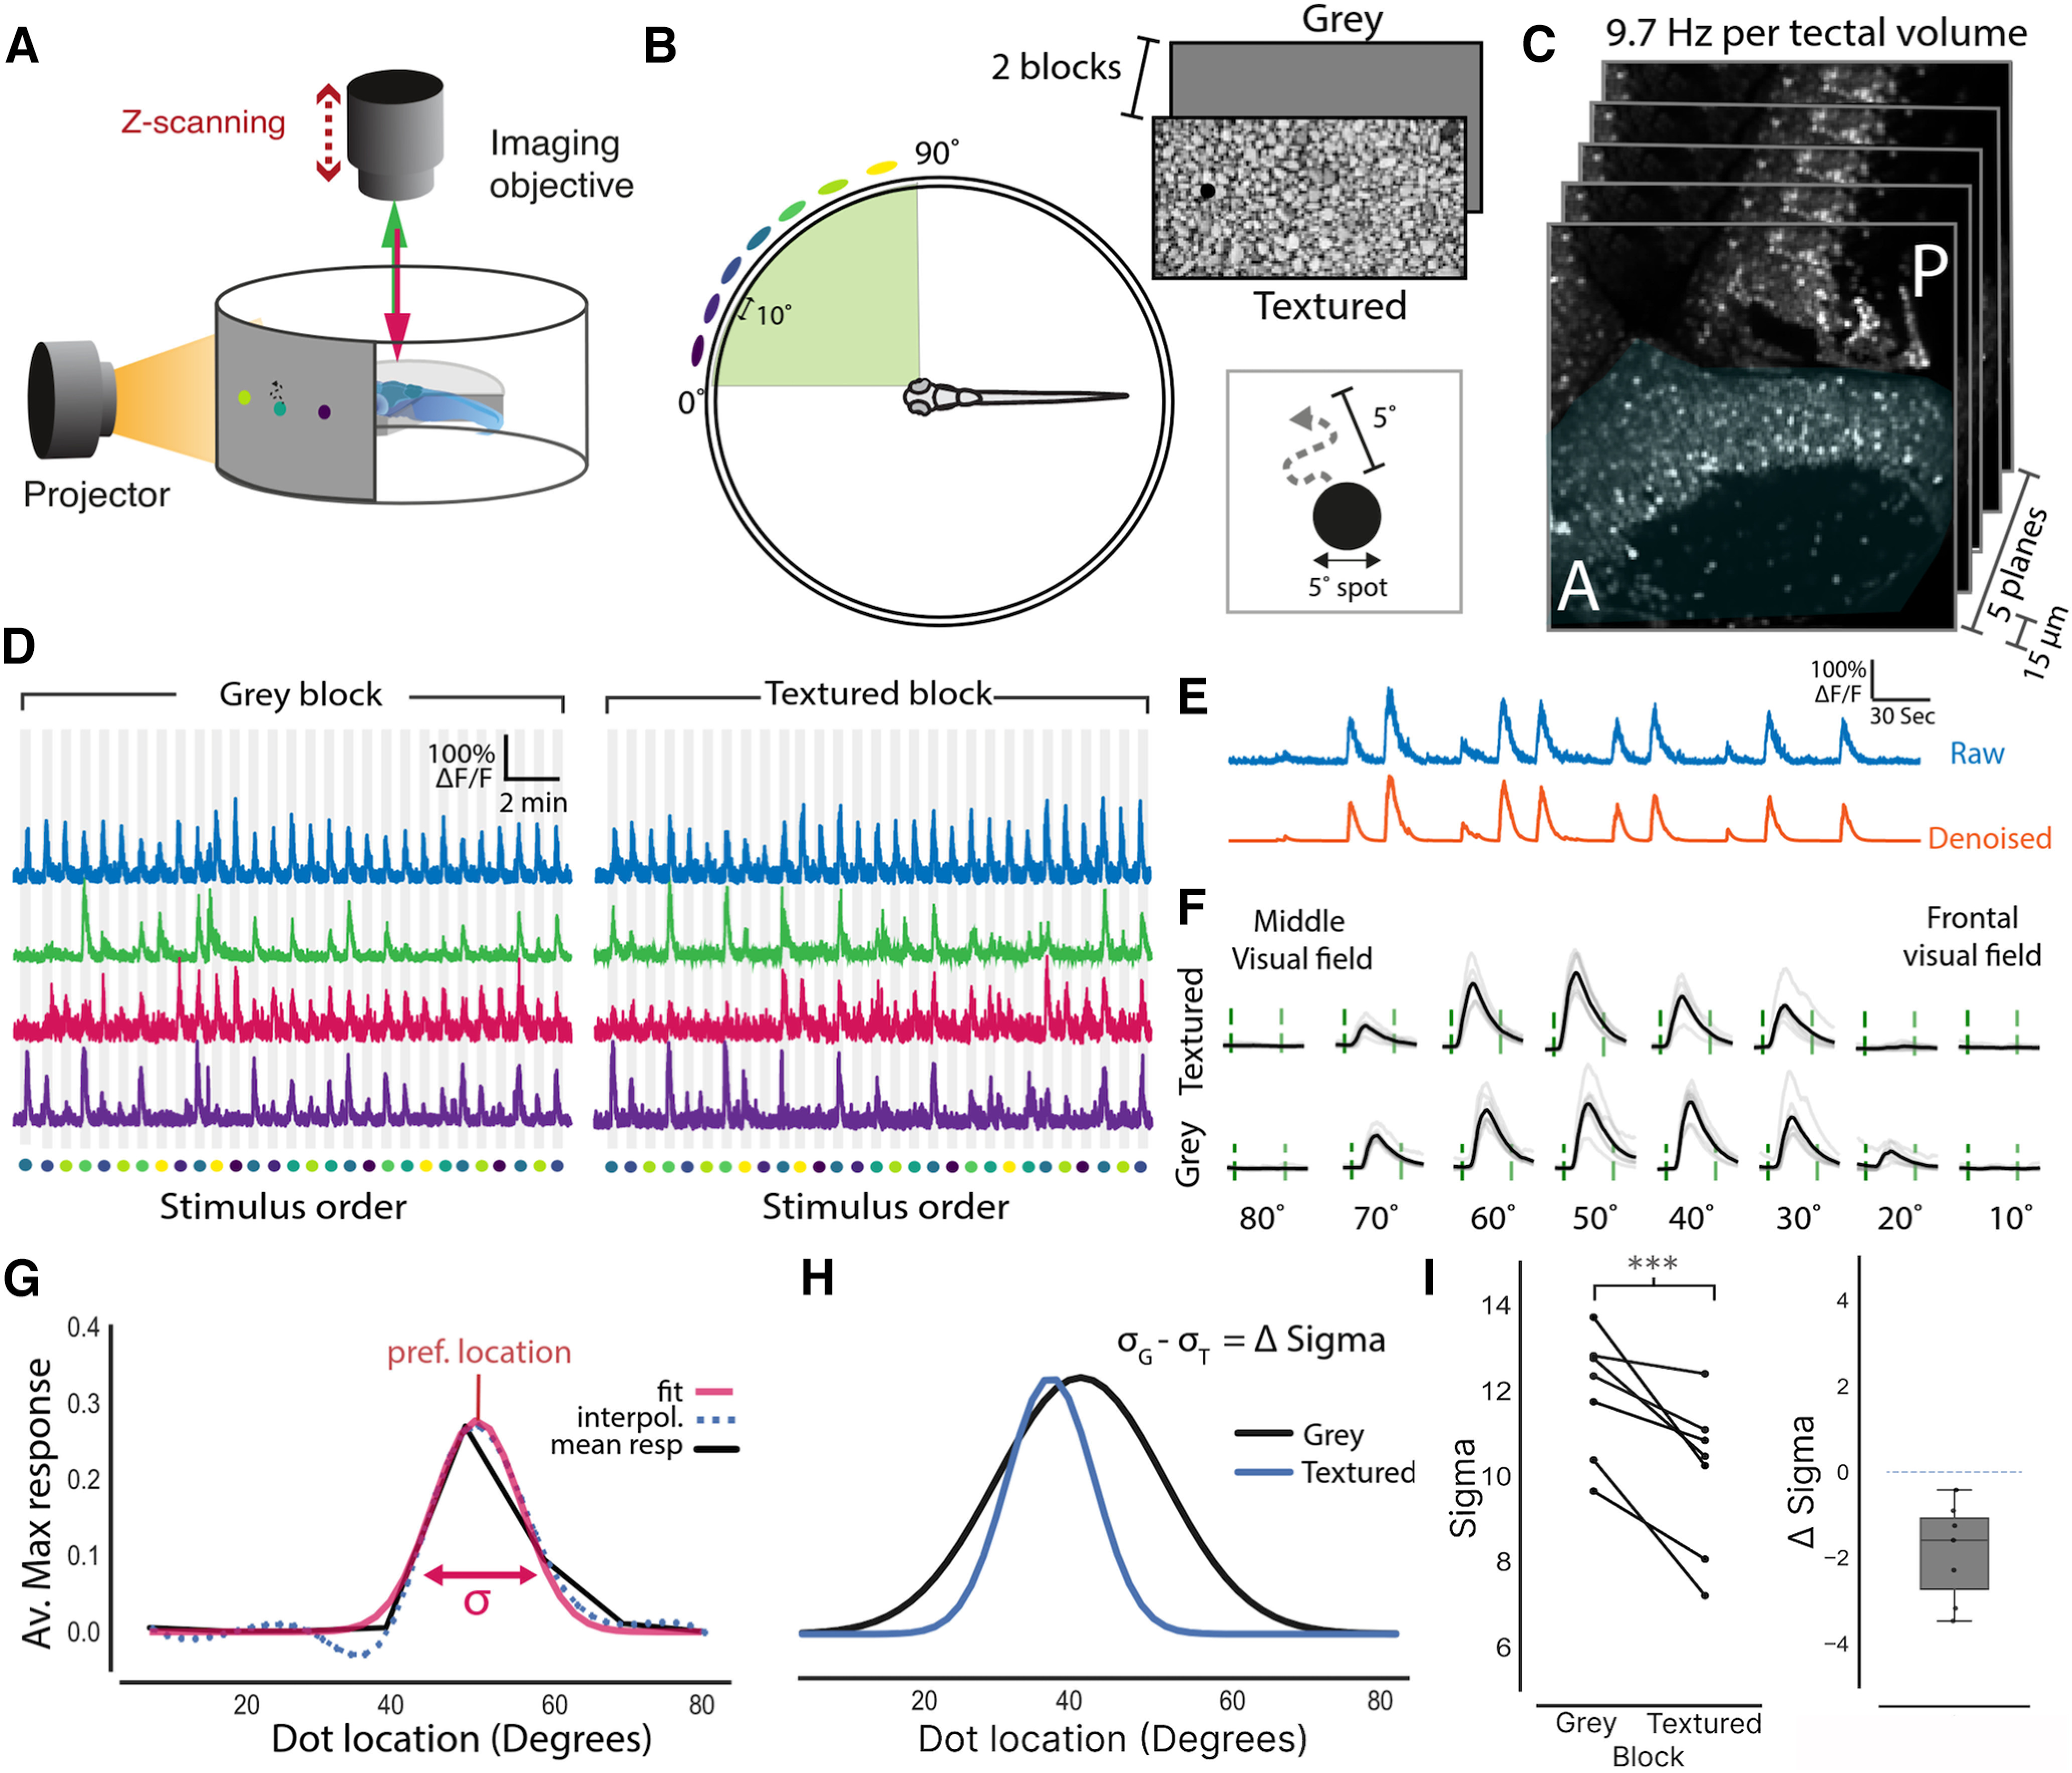
Presenting stimuli over a textured background sharpens the spatial tuning of tectal neurons. A, Schematic of the imaging setup where larvae were head fixed in agarose allowing for visual stimuli to be projected onto a semicylindrical screen while neural activity is monitored via two-photon volumetric imaging. B, A schematic showing that 5° moving dots (virtual prey) were presented at seven different locations along visual azimuth separated by 10°. These dots moved randomly within a 5° neighbored and were presented in two blocks with different backgrounds, gray screen or textured (gravel). A more extensive comparison between the statistics of these two backgrounds is provided in Extended Data Fig. 1-1). C, Imaging volumes of the contralateral tectum (shaded blue) consisted of five optical sections that were taken 15 μm apart at an imaging speed of 9.7 Hz per volume. D, Normalized fluorescence traces from cells that are active in both the gray and textured blocks. Stimulus location is color coded as in B. E, Raw fluorescence traces were denoised to generate smoothed calcium signals. F, Mean responses to each of the stimulus locations (black) and individual repetitions (gray) for an example cell. Stimulus epoch start and end are indicated by the green dashed lines. G, Spatial tuning curves for each cell were calculated by fitting a Gaussian to the interpolated average maximum response to each stimulus location. The preferred stimulus location was taken as the peak and tuning sharpness was taken as the standard deviation (σ) of the Gaussian fit. H, Tuning fits for an example neuron for both the textured and gray backgrounds. From this, a neuron’s change in σ (Δ σ) can be calculated by subtracting its σ value for the gray background (σG) from its σ for the textured background (σT). I, Left, Mean σ values for tectal neurons in both textured and gray blocks. Each connected line represents one fish (n = 7). Sigma was reduced for all fish in the textured block relative to the gray block (paired t test, p < 0.001). Right, A box plot showing the mean change in σ for each fish between the two blocks. Dotted line indicates zero change. This contextual modulation effect was found to be robust to the interpolation method that was used before fitting the Gaussian (Extended Data Fig. 1-2). To ensure that visual responses were not saturated in the these experiments a contrast sensitivity experiment was performed (Extended Data Fig. 1-3); ***p < 0.001.