Figure 2.

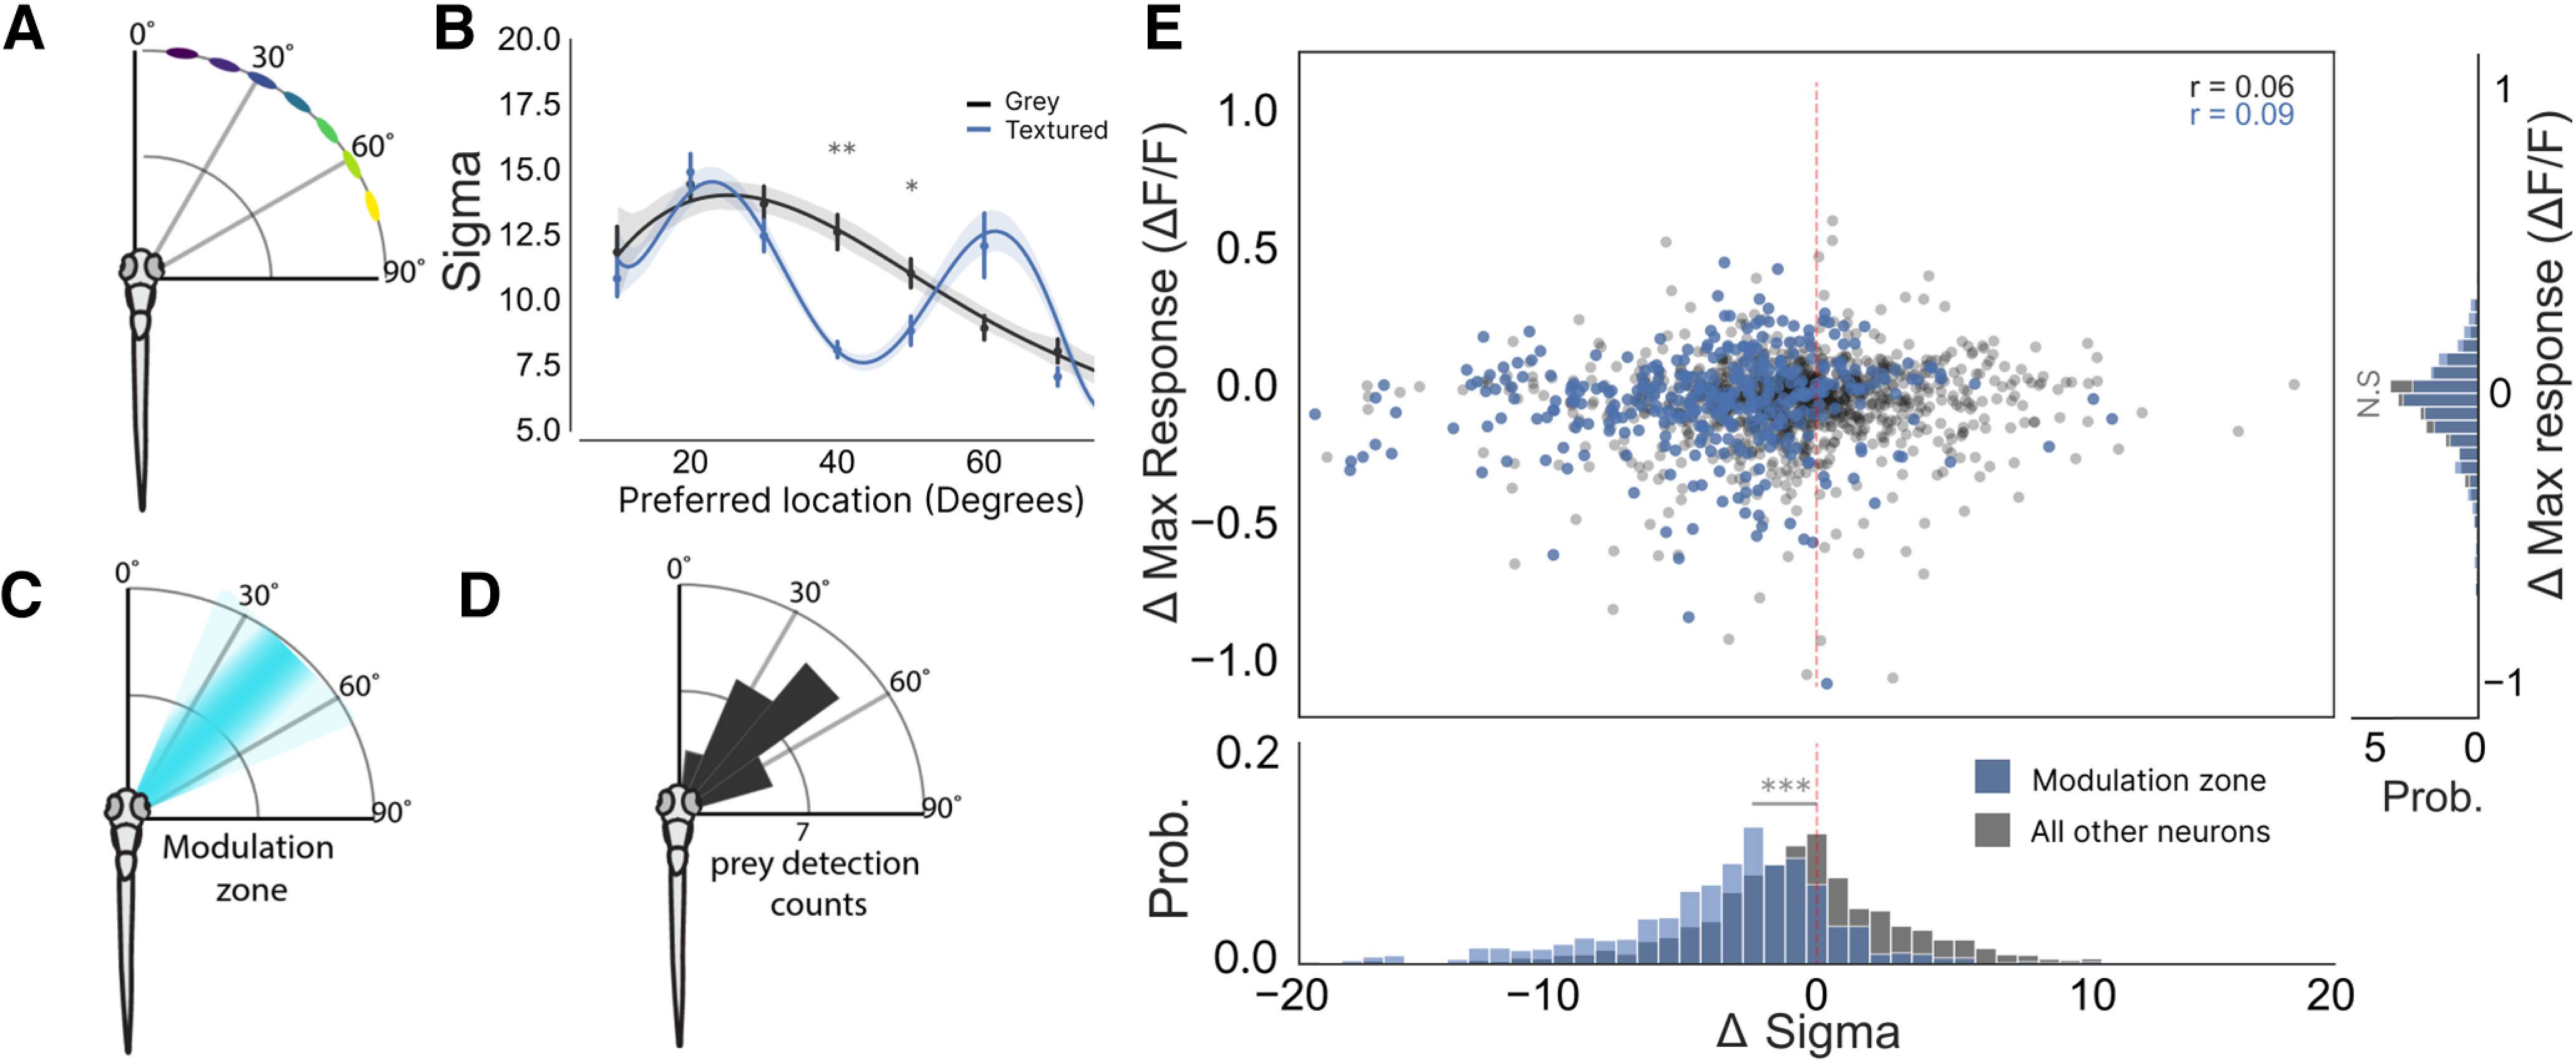
Contextual modulation takes place in a spatially restricted region of visual azimuth. A, A schematic of stimulus location relative to the fish’s body axis. B, A plot of σ against neuron’s preferred stimulus location for each fish, which demonstrates that spatial tuning exhibits contextual sharpening only for stimuli presented between 35° and 50° of visual azimuth (40°: p = 0.02, 50°: p = 0.05, two-way ANOVA, t tests with Bonferroni correction). C, A schematic showing the zone in visual space where contextual modulation occurs. D, This modulation zone corresponds to the area in visual space where hunting routines are preferentially triggered (modified from Romano et al., 2015). E, Top, A scatter plot showing that a neuron’s change in maximum response is not correlated with its change in its σ [modulation zone neurons (blue) Pearson’s r = 0.09; all other tectal cells (dark gray) Pearson’s r = 0.06]. Cells within the modulation zone are highlighted in blue and were defined as cells which had a preferred tuning between 35° and 48°. Right, Histogram showing the difference in Δ max response for neurons within the modulation zone and all other tuned neurons (p = 0.7, t test). Bottom, Histogram showing the difference in Δσ for neurons within the modulation zone and all other tuned neurons (p < 0.001, t test); *p < 0.05, **p < 0.01, ***p < 0.001, N.S = not significant (p > 0.05).
