
Extended Data Fig. 3. p53 associates with PDK1, FOXOs, and IPMK.
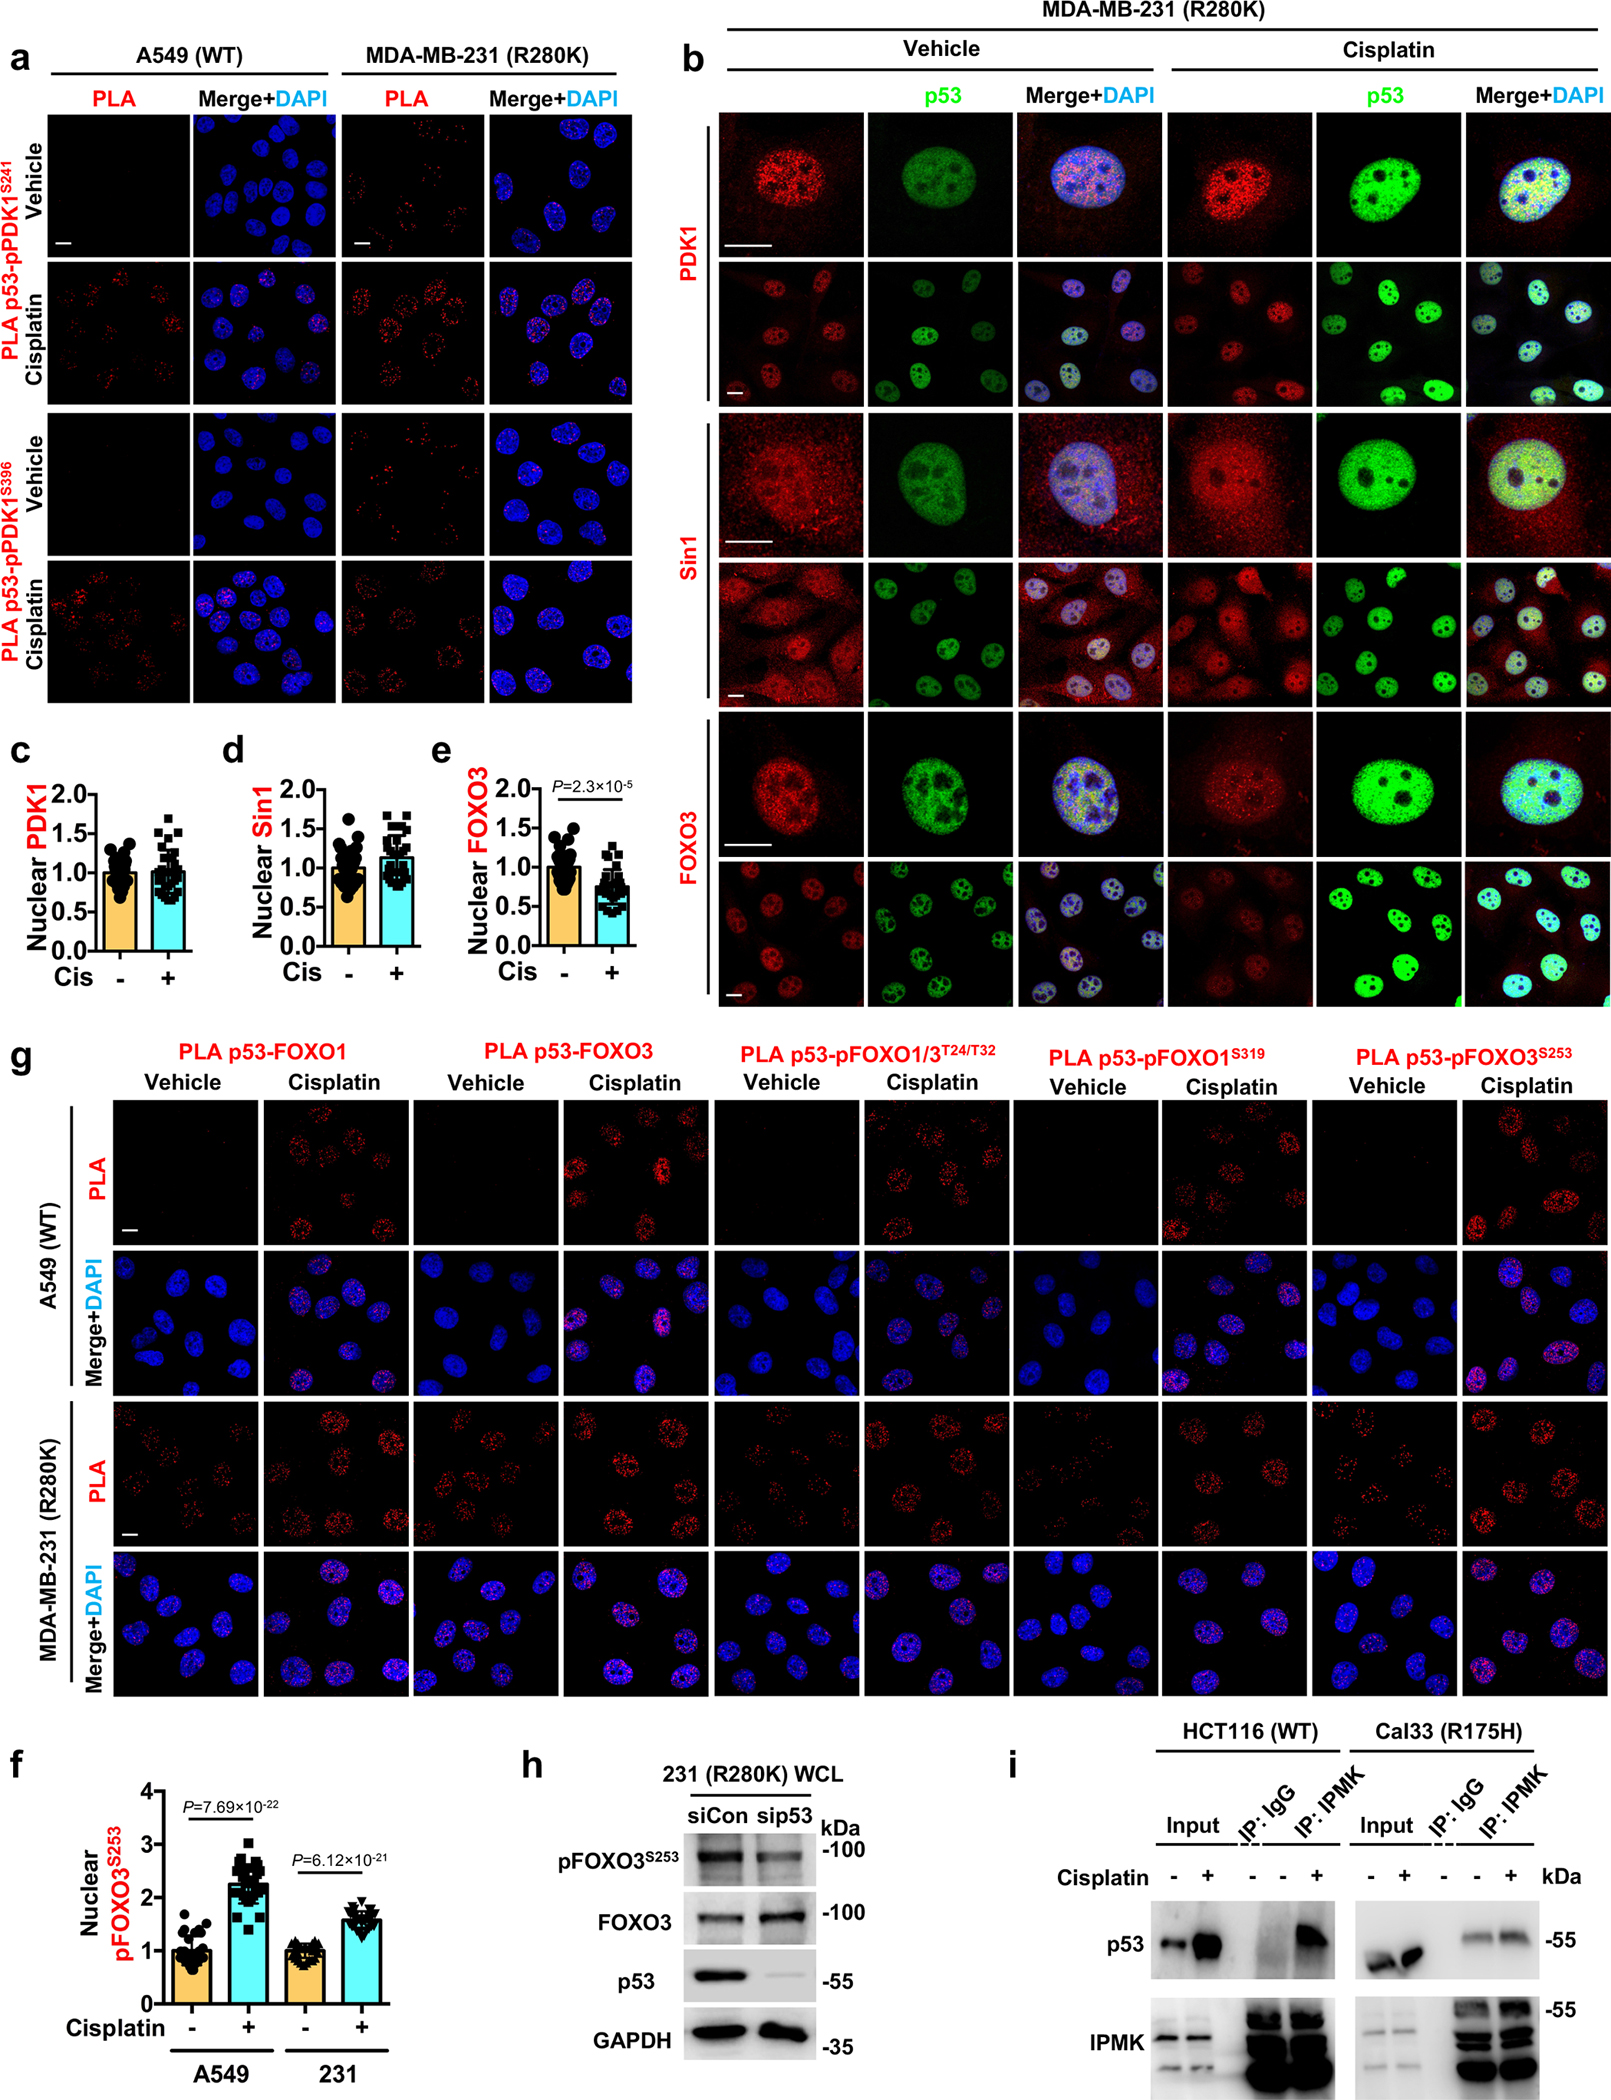
a, PLA of p53-pPDK1S241/pPDK1S396 in A549 and MDA-MB-231 cells treated with control vehicle or 30 μM cisplatin for 24 h. See quantification in Fig. 2e.
b-e, Confocal images of IF staining against PDK1/Sin1/FOXO3 and p53 in MDA-MB-231 cells treated with control vehicle or 30 μM cisplatin for 24 h. The nuclear levels of PDK1 (c), Sin1 (d), FOXO3 (e) normalized to vehicle treated cells were quantified. N=30 cells from representative experiments of three repeats.
f, Quantification of nuclear pFOXO3S253 in A549 and MDA-MB-231 cells treated with control vehicle or 30 μM cisplatin for 24 h (levels normalized to vehicle treated cells). N=30 cells from representative experiments of three repeats. Representative images are shown in Fig. 3e.
g, PLA of p53-FOXOs in A549 and MDA-MB-231 cells treated with vehicle or 30 μM cisplatin for 24 h. See quantification in Fig. 3g.
h, MDA-MB-231 cells were transient transfected with control siRNAs or siRNAs against p53 for 48 h. Then the cell lysates were analyzed by WB for p53/FOXO3/pFOXO3S253. Representative data of three independent experiments are shown.
i, Co-IP of IPMK with wild-type and mutant p53 from HCT116 and Cal33 cells respectively treated with 30 μM cisplatin or control vehicle for 24 h. Representative data of three independent experiments are shown.
For all panels, data are represented as mean ± SD, p value denotes t-test. Scale bar: 5 μm.