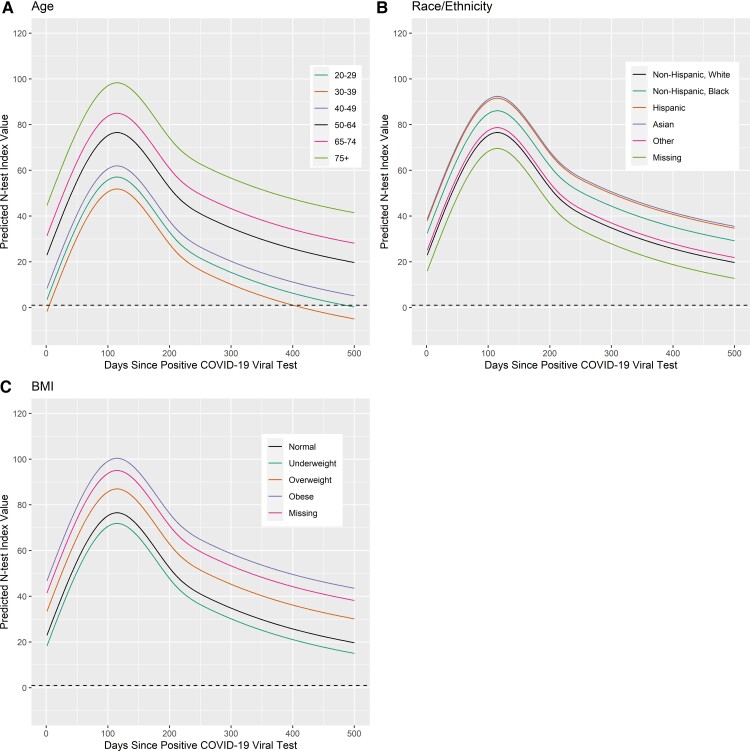
Figure 2.
Predicting nucleocapsid antibody status varying demographics in the reference model. The dashed line at 1 represents when the N-test reports a positive antibody response. N-test value ≥ 1 is a positive antibody response. The solid black line represents the reference prediction curve, that is for a 50 to 64-year-old non-Hispanic white woman without chronic conditions, with healthy BMI, who has insurance coverage, was asymptomatic in their infection, was not hospitalized, and did not use tobacco or vaping. The effect of varying a covariate across its domain is shown: (A) varying age, (B) varying race\ethnicity, and (C) category of BMI status. Abbreviations: BMI, body mass index; COVID-19, coronavirus disease 2019; N-test, nucleocapsid antibody test.

