
FIGURE 6.
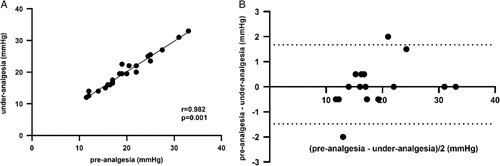
Correlation between the pre-analgesia and under-analgesia HVPG with 1.5 µg/mg fentanyl administration. (A) The scatterplot shows the agreement between the pre-analgesia and under-analgesia HVPG. (B) The Bland–Altman plot shows the difference between the pre-analgesia and under-analgesia HVPG.