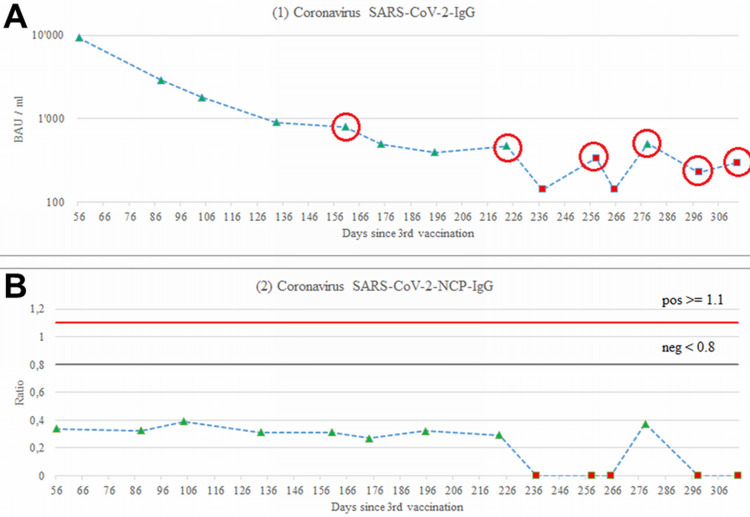
Figure 3. Spike antibody levels over time based on the drawing date as opposed to the vaccination date .
A: Normal NCP-IgG antibodies
B: Red data points indicate results from a different laboratory than the green data points (both used the ELISA method). Yet, even laboratory values suggest inverting slopes. For instance, laboratory 1 reported a value of 394 (24.7.2022) and 505 (15.10.2022), an increase of over 28% despite 83 days of time decay. Likewise, laboratory 2 reported 142 (4.9.2022) and 226 (4.11.2022), an increase of 59% despite 61 days of time decay. Values in between highly fluctuate beyond 100% around these low absolute threshold areas. Measurements were re-assessed once by the laboratory suggesting a variation < +-11%. This is surprising as the case had no virus infection over time (lower panel). The red dots for the NCP are of qualitative nature from laboratory 2.
NCP: Novel coronavirus pneumonia

