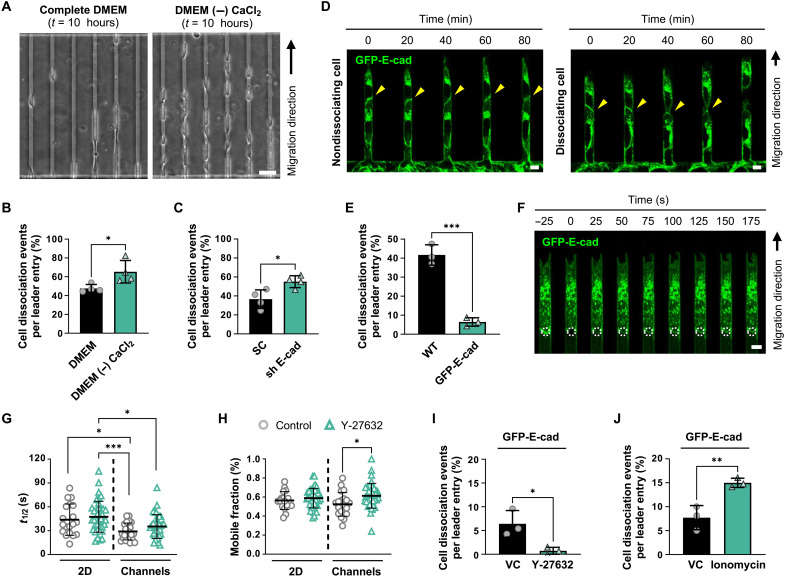
Fig. 2. Junctional E-cadherin dynamics are enhanced in cells under confinement.
(A) Representative phase-contrast images of A431 WT cells after 10 hours of migration in confining (W = 6 μm) microchannels in the presence (complete DMEM) or absence of calcium [DMEM (−) CaCl2]. (B) Percentage of A431 WT leader cells that detach in the presence or absence of CaCl2. Data represent means ± SD for n ≥ 502 cells from four experiments. (C) Percentage of SC or E-cadherin shRNA leader cells that dissociate in confining microchannels. Data represent means ± SD for n ≥ 446 leader cells from four experiments. (D) Representative confocal images of GFP-E-cad–expressing A431 cells that fail to dissociate (left) or successfully dissociate (right) in confining microchannels. In both cases, E-cadherin is localized to the leader-follower junction (yellow arrowheads). (E) Percentage of WT and GFP-E-cad–expressing A431 leader cells that dissociate in microchannels. Data represent means ± SD for n ≥ 365 leader cells from three experiments. (F) Representative confocal images of GFP-E-cad following FRAP at a cell-cell junction (white dashed circles). (G and H) Half-lives (t1/2) (G) and mobile fractions (H) of junctional E-cadherin recovery calculated from individual cell recovery curves in control and Y-27632–treated cells. Data represent means ± SD for n ≥ 18 leader cells from three to four experiments. (I) Percentage of GFP-E-cad–expressing A431 leader cells that dissociate in microchannels under vehicle control (VC) or Y-27632 treatment. Data represent means ± SD for n ≥ 246 cells from three experiments. (J) Percentage of GFP-E-cad–expressing A431 leader cells that dissociate in microchannels under VC or ionomycin treatment. Data represent means ± SD for n ≥ 316 cells from three experiments. Tests performed: Student’s t test (B, C, E, I, and J), one-way ANOVA after log transformation (G), or Kruskal-Wallis test (H). *P < 0.05, **P < 0.01, and ***P < 0.001. Scale bars, 50 μm (A) or 6 μm (D and F).

