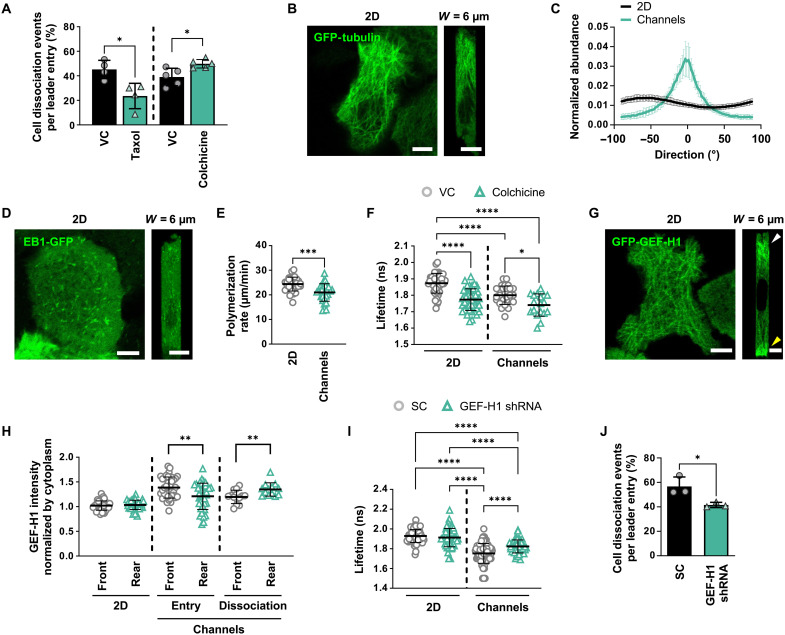
Fig. 5. Confinement alters microtubule organization and dynamics, resulting in GEF-H1–mediated RhoA activation.
(A) Percentage of WT leader cells that dissociate in confining microchannels under taxol (n ≥ 369 cells, four experiments) or colchicine (n ≥ 514 cells, five experiments) treatment. Data represent means ± SD. (B and C) Representative confocal images (B) and directionality (C) of GFP-tubulin in cells on 2D or in microchannels. 0° is parallel to the direction of migration. Data represent means ± SD for n ≥ 32 cells from three experiments. (D) Representative confocal images of cells expressing EB1-GFP on 2D (left) or in microchannels (right). (E) Microtubule polymerization rates of EB1-GFP in cells on 2D and in microchannels. Data represent means ± SD for n = 30 cells from three experiments. (F) Donor fluorescence lifetime of RhoA activity following colchicine treatment of cells on 2D and in confinement. Data represent means ± SD for n ≥ 18 cells from three experiments. (G) Representative confocal images of cells expressing GFP-GEF-H1 on 2D (left) or in microchannels (right). (H) Mean intensity of GFP-GEF-H1 at the front and rear of cells on 2D, upon cell entry into confinement, and at the time of dissociation. Values were normalized to the mean intensity of the cytoplasm in each cell. Data represent means ± SD for n = 13 to 39 cells from five experiments. (I) Donor fluorescence lifetime of RhoA activity in SC or GEF-H1 shRNA cells on 2D and in confinement. Data represent means ± SD for n ≥ 43 cells from four experiments. (J) Percentage of SC or GEF-H1 shRNA leader cells that dissociate in confining microchannels. Data represent means ± SD for n ≥ 272 leader cells from three experiments. Tests performed: Student’s t test (A, E, H, and J) (during entry), Student’s t test after log transformation (H) (during dissociation), one-way ANOVA test (F and I), or two-way ANOVA (C) (see table S3). *P < 0.05, **P < 0.01, ***P < 0.001, and ****P < 0.0001. Scale bars, 6 μm. Cell model: A431.

