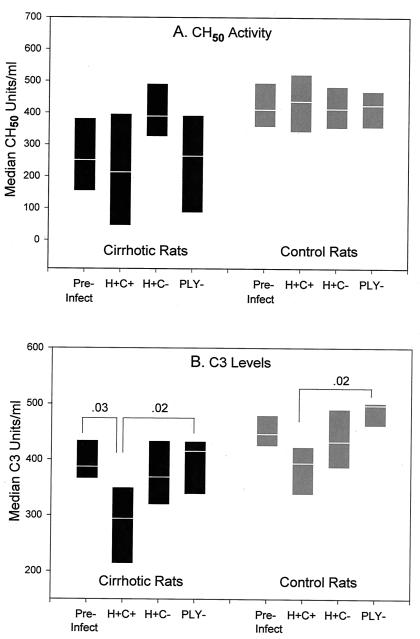
FIG. 3.
Comparative alterations in CH50 activity levels (A) and C3 levels (B) during infection with isogenic mutant strains. All rats were bled 2 days before infection (pre-infect) and again 18 h postinfection with 1 × 10⁷ to 5 × 10⁷ CFU of one of the isogenic mutant strains per ml of peripheral blood. Postinfection groups are labeled with the organism strain designation (n = 9 cirrhotic and 13 control animals for the H+C+ strain and 6 each for the H+C− and PLY− strains). Serum CH50 activity levels and C3 levels shown are medians, with the range from the 25th to the 75th percentile indicated. Significant differences (indicated by bars) between pre- and postinfection values were calculated by the Mann-Whitney U test. Differences among 18-h values for rats in the same treatment group infected with different strains were calculated by the Kruskal-Wallis test.

