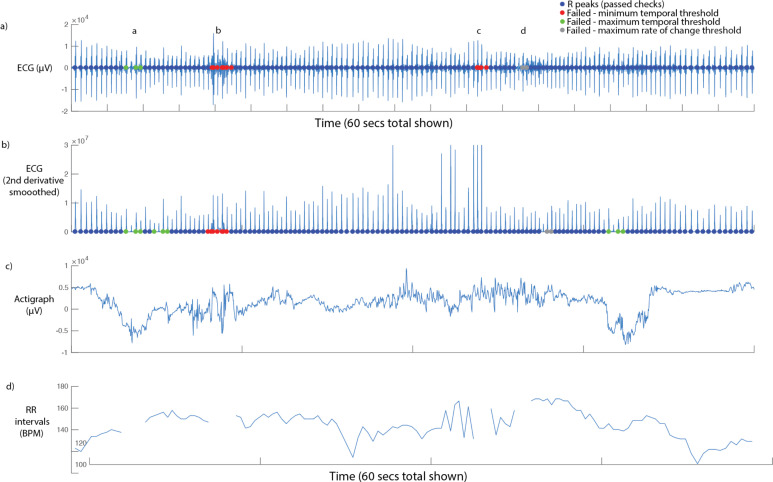
Appendix 1—figure 1. Sample screenshot from ECG parsing algorithm.
60 seconds’ data is shown. From top to bottom: (i) raw ECG signal. Coloured dots show the results of the three checks described in the main text, below (see legend); (ii) smoothed second derivative of ECG signal. This measure was not used as our pilot analyses found it to be less effective than applying the processing to the raw signal; (iii) raw (unprocessed) actigraph data. This information was only used for visual inspection, and was not used in parsing; (iv) RR intervals (in BPM), with rejected data segments excluded.

