
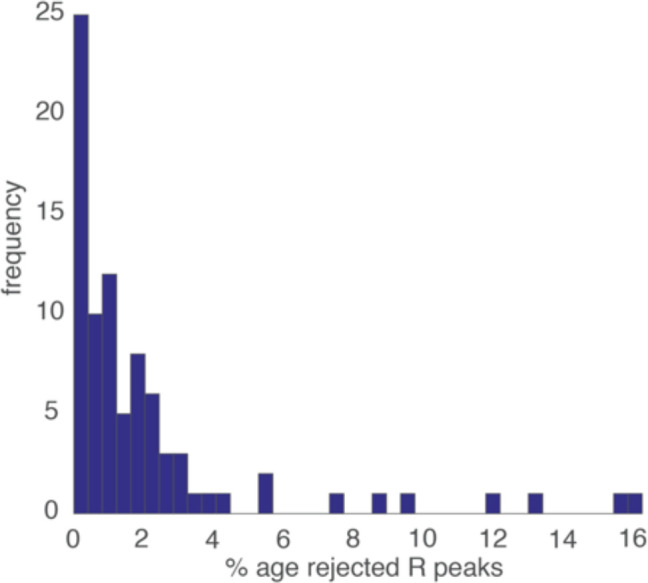
Appendix 1—figure 2. Histogram showing the proportion of rejected R peaks (as identified using the three criteria described above).
Official websites use .gov
A
.gov website belongs to an official
government organization in the United States.
Secure .gov websites use HTTPS
A lock (
) or https:// means you've safely
connected to the .gov website. Share sensitive
information only on official, secure websites.