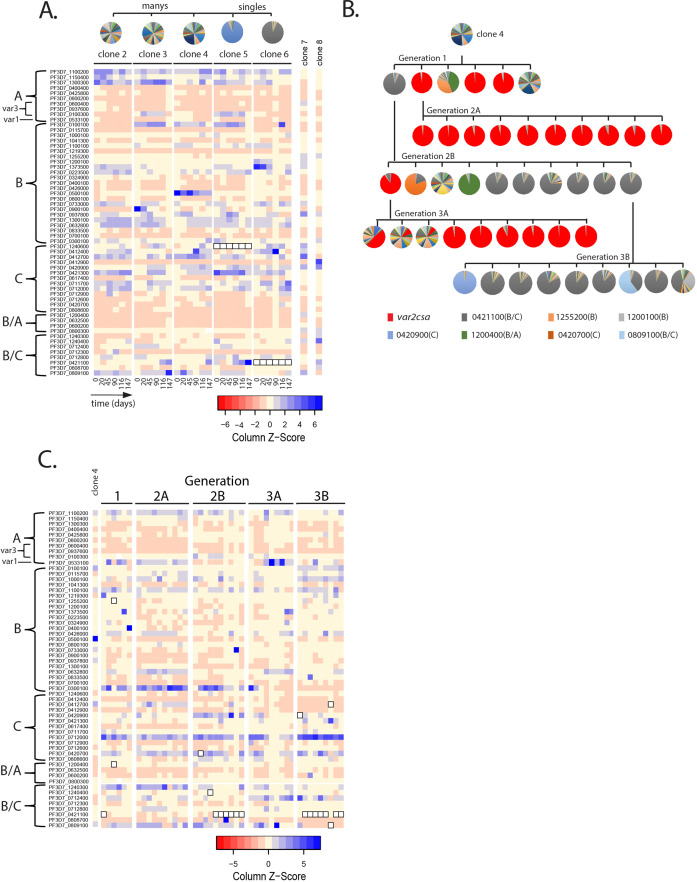
Figure 2. Detection of var gene minor transcript expression profiles in clonal populations overtime.
(A) Heatmap of var minor transcripts for clones 2–6. The clones were all derived from the same parent population as shown in Figure 1D. Pie charts show the initial var gene expression profiles above the heatmap. The annotation numbers for each var gene are shown to the left of the heatmap and organized according to var type (left, var2csa is considered separately in Figure 3). Six time points are included for each clone. Two genetically identical parasite populations (clones 7 and 8) also originally derived from 3D7 but grown separately for several years are shown for comparison. For clones 5 and 6, the dominant transcript (PF3D7_1240600 and PF3D7_0421100, respectively, marked by black boxes in the heatmap) was removed from the analysis to enable visualization of the minor transcripts. (B) Clone tree of wildtype 3D7. The tree is organized into three ‘subclone generations’ derived from initial clone 4 (top row). Pie charts display the var expression profile for each subclone. (C) Heatmap of var minor transcripts for the individual clones from each generation shown in B with the pattern of the parent population (clone 4) shown at the left for comparison. The annotation numbers for each var gene are shown to the left of the heatmap, and the gene order was organized according to var type. The order from left to right of each column in the heatmap corresponds to the order from left to right of the pie charts for each subclone generation shown in B. For parasites expressing the ‘single’ phenotype, the dominant transcript (marked by black boxes in the heatmap) was removed to enable visualization of the minor transcripts.

