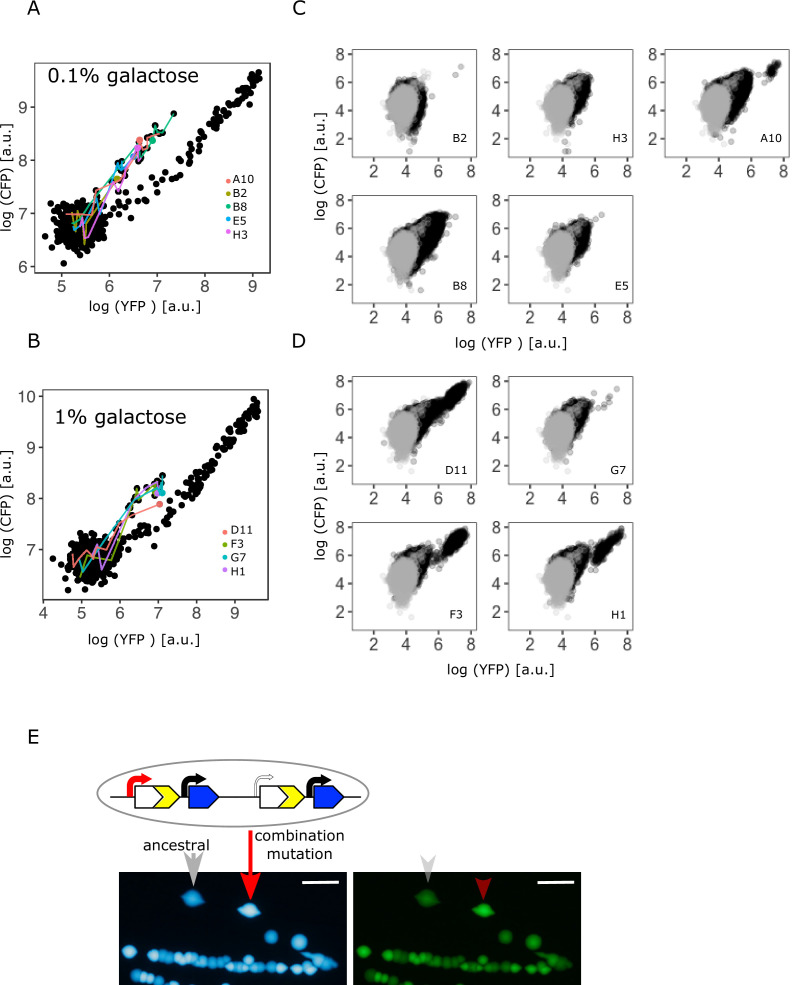
Figure 3. Confirming the presence of a combination of copy-number and point mutations in intermediate and high galactose.
(A–B) Log plot of YFP and CFP fluorescence of all 96 IS+ populations during evolution in 0.1% (A) and 1% (B) galactose (black points), respectively. Data replotted from Figure 2B for an overview of population fluorescence of all mixed fraction populations (coloured points). Time points of measurements are indicated by the degree of shading. (C–D) Single-cell fluorescence phenotypes as measured by flow cytometry of all mixed fraction populations identified in (A–B) after 12 days of evolution, respectively, indicate the presence of combination mutations (an increase of both YFP and CFP within a single cell as opposed to a mixed population of cells with either an increase in YFP or an increase in CFP, compare to Figure 2C). (E) Sanger sequencing of individual colonies allows to determine the genotype of an evolved clone of any fluorescence phenotype. Images of CFP (left) and YFP (right) fluorescence of individual colonies from a representative IS+ population (A10) streaked onto LB agar after having evolved in 0.1% galactose for 12 days. Sanger sequencing of the P0 sequence revealed a T>A point mutation in an amplified (red arrow) but not an ancestral colony (grey arrow). Scalebars: 1cm.

