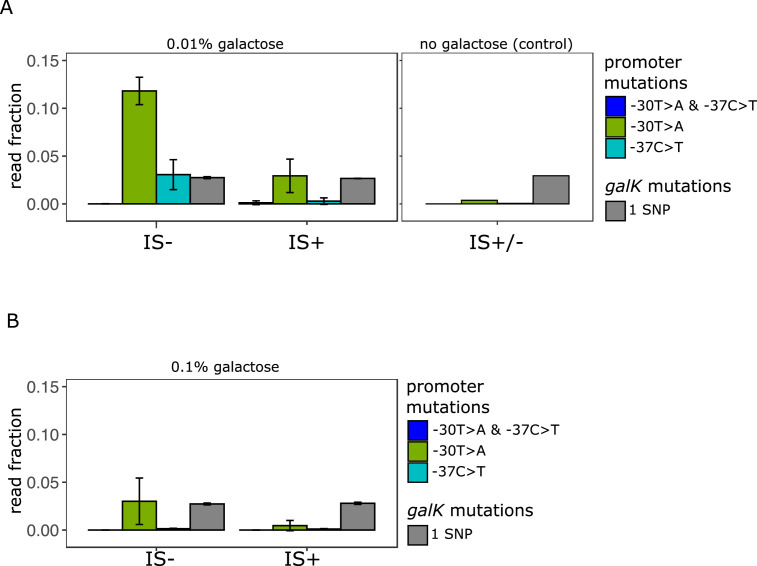
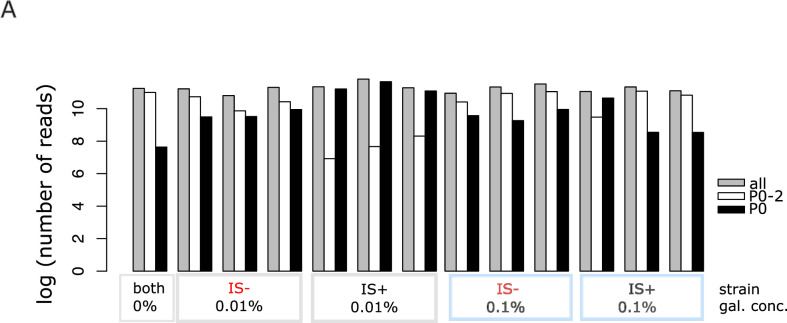
Figure 5. Amplicon deep sequencing of P0 in pooled evolved populations.
(A) (Left panel) Number of reads carrying a P0 sequence with two adaptive SNPs 30 and 37 bp upstream of galK, respectively (‘T>A + C>T’ in blue) or its respective single SNPs (‘T>A’ in green, ‘C>T’ in cyan). Values are normalized to the number of reads with ancestral P0 for IS- and IS+ populations evolved in 0.01% galactose. The mean fraction of reads with any single SNP in galK is shown as a control (grey). Error bars represent the standard deviation of three replicates, consisting each of 32 pooled evolved populations. (Right panel) Read fractions of the same respective SNPs shown for a pool of all 96 IS+ and IS- populations evolved in the absence of galactose. (B) Mean read fractions as in (A) shown for three replicates of each 32 pooled populations evolved in intermediate (0.1%) galactose.


