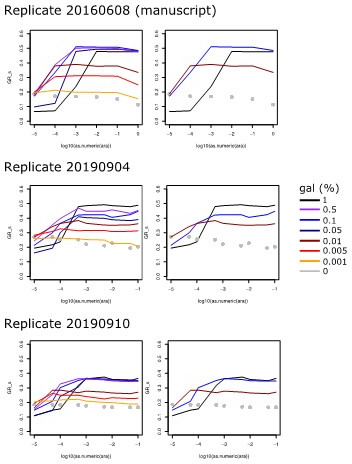
Author response image 1. Replicates of the Experiment shown in Figure 1b, where growth rate is plotted against arabinose concentration used to induce galK expression for different galactose concentrations (line colors, see legend).

Left panels show all tested galactose concentrations, while right panels show the relevant galactose concentrations used in the experiments of the manuscript.
