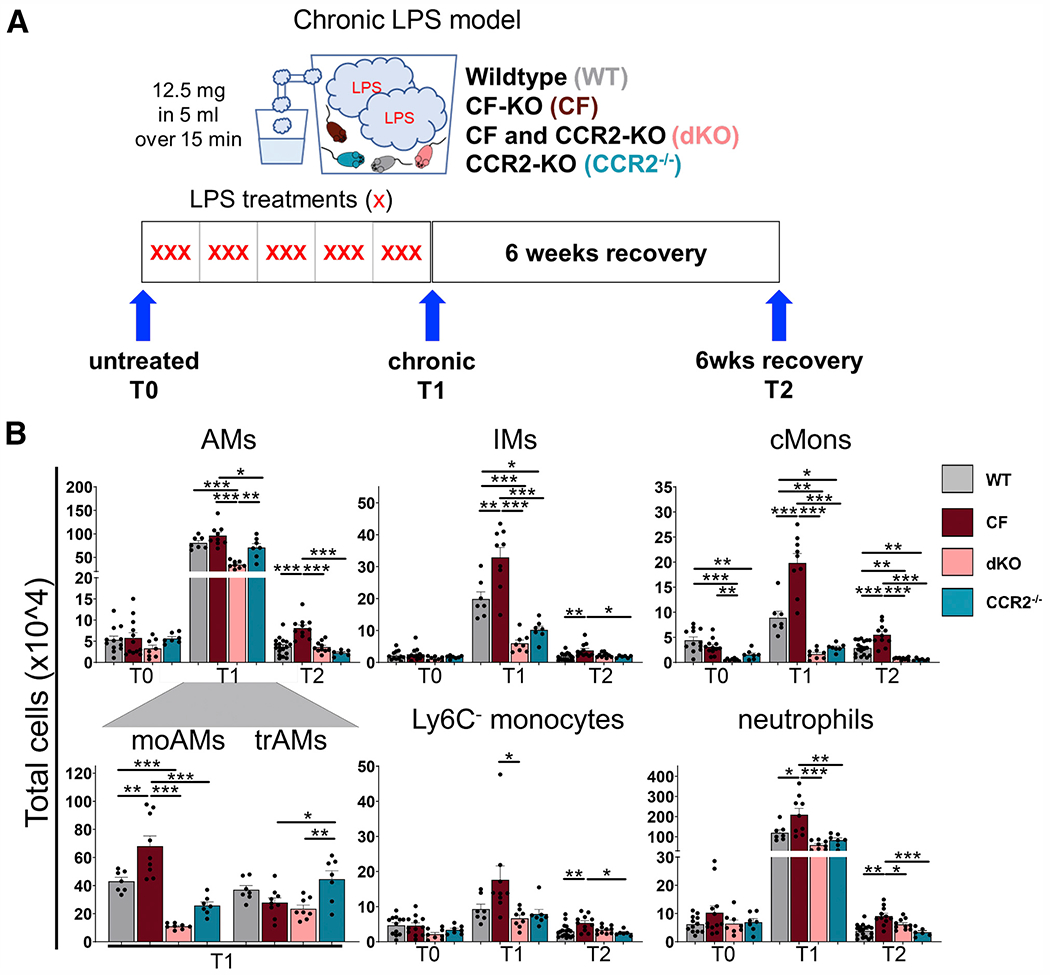
Figure 2. Elevated numbers of cMons and monocyte-derived macrophages promote and perpetuate neutrophilic pulmonary inflammation in CF.

(A) Chronic LPS model. WT, CF, dKO, and CCR2−/− mice were nebulized with LPS from PA 3 times per week over 5 weeks (15 doses total) and sacrificed 24 h after the last nebulization (chronic endpoint [T1]) or left to recover for 6 weeks (recovery endpoint [T2]). At each time point, BALF and lung tissue were collected for flow cytometry, histology, RNA, and protein analysis. T0 indicates untreated mice.
(B) Total cell numbers of total AMs, moAMs, trAMs, IMs, cMons, Ly6C− Monos, and neutrophils were quantified by flow cytometry as percentage of viable cells multiplied by the total cell count in the inferior lung lobe. The gating strategy is described in Figure S3.
Data are generated from three independent experiments with 2–6 mice per genotype and time point. Each biological replicate is represented by a dot. Bars are depicted as means ± SEM, and p values were calculated using one-way ANOVA and Tukey’s test for multiple comparisons between the genotypes for each time point separately (*p < 0.05, **p < 0.01, ***p < 0.001). See also Figures S2 and S3.
