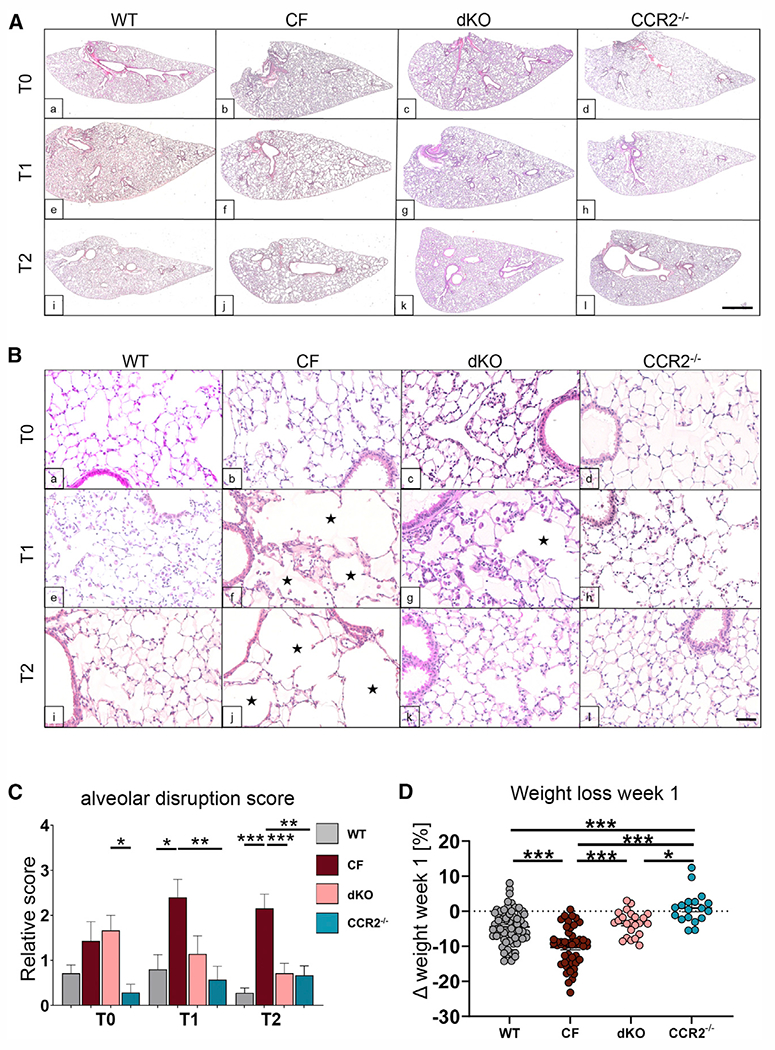
Figure 3. Enhanced CCR2-mediated monocyte recruitment drives pathogenic tissue remodeling in CF lungs.

(A and B) Representative subgross H&E images of lung from WT, CF, dKO, and CCR2−/− mice at T0, T1, and T2. Black stars indicate enlarged alveolar spaces. Scale bars: 500 μm (A) and 50 μm (B).
(C) Relative alveolar disruption score from semiquantification analysis of lung histology. Bars are depicted as means ± SEM for 4 or more mice per genotype and time point.
(D) Relative weight loss of mice after week 1 of LPS administration. Each dot represents one biological replicate.
r multiple comparisons between the genotypes for each time point separately (*p < 0.05, **p < 0.01, ***p < 0.001). See also Figures S4, S5, and S6.
