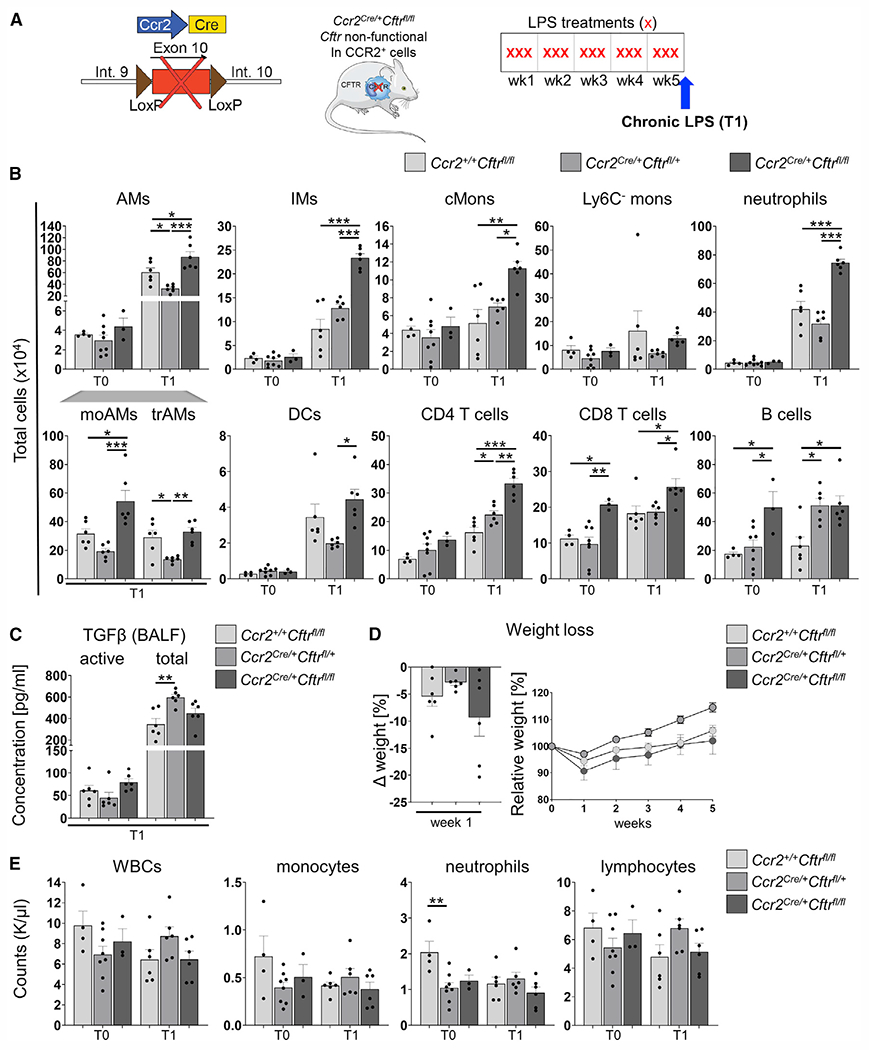
Figure 6. CFTR deficiency in CCR2-expressing cells drives excessive accumulation of lung immune cells in response to chronic LPS.

(A) Schematic of the chronic LPS model and Ccr2cre/+Cftrfl/fl mice.
(B) Total cell numbers of AMs, moAMs, trAMs, IMs, cMons, Ly6C− Monos, neutrophils, DCs, CD4 T cells, CD8 T cells, and B cells in lung tissue homogenates were quantified by flow cytometry as percentage of viable cells multiplied by the total cell count in the inferior lung lobe. The gating strategy is described in Figure S3.
(C) Quantification of active and total TGF-β levels in BALF at T1 by ELISA.
(D) Weight loss during 5 weeks of chronic LPS (right) and after the first week of LPS (left).
(E) CBCs at T0 and T1.
Data are generated from two independent experiments with 2–3 mice per genotype and time point. Each biological replicate is represented by a dot. Bars are depicted as means ± SEM, and p values were calculated using one-way ANOVA and Tukey’s test for multiple comparisons between the genotypes for each time point separately (*p < 0.05, **p < 0.01, ***p < 0.001).
