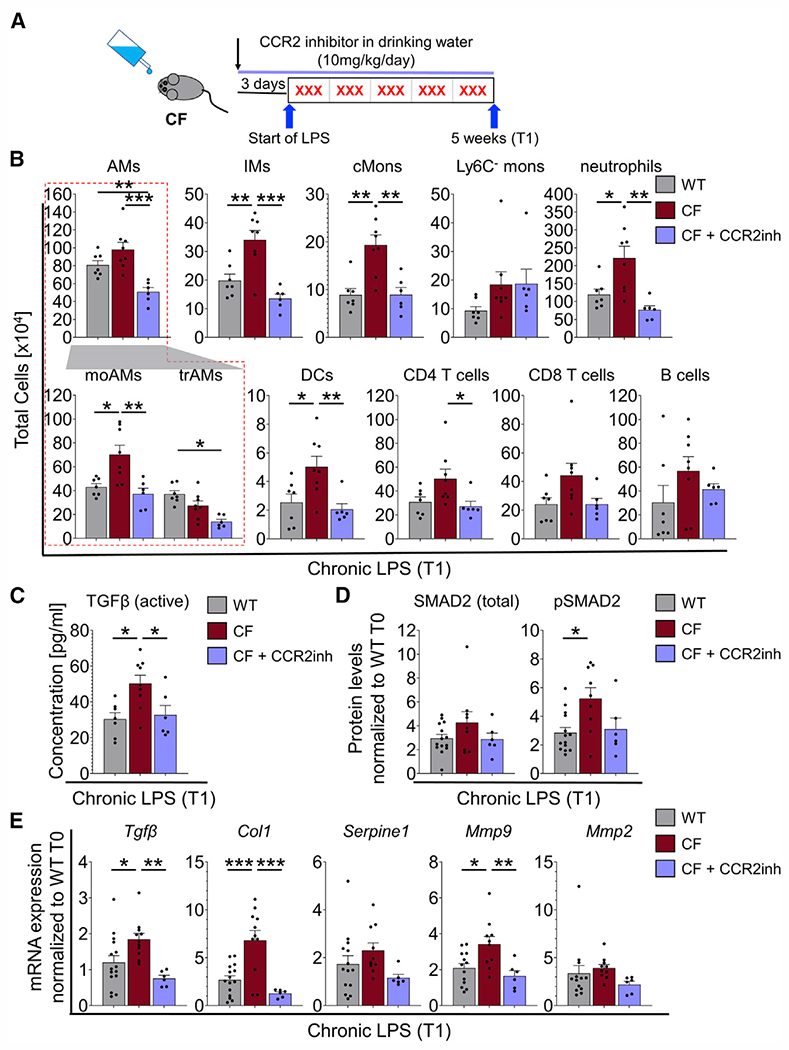
Figure 7. Pharmacological targeting of CCR2 mitigates cMon recruitment and normalizes TGF-β levels in CF lungs.

(A) Chronic infection model. CF mice were treated with CCR2 inhibitor (CCR2inh) starting 3 days before the first nebulization and throughout the experiment.
(B) Quantification of flow cytometry analysis of lung immune cells (see Figures 1B and 1C) of CF + CCR2inh-treated mice compared with WT and CF mice at T1.
(C) Active levels of TGF-β at T1.
(D) Densitometric analysis of western blot bands from lung tissues of WT, CF, and CF + CCR2inh mice at T1. The expression levels were normalized to VINCULIN and the WT at T0.
(E) mRNA expression levels in lung tissues of WT, CF, and CF + CCR2inh mice at T1. The expression was normalized to 18S and the WT at T0.
Each biological replicate per genotype and experimental condition is represented by a dot. Bars are depicted as means ± SEM, and p values were calculated using one-way ANOVA and Tukey’s test for multiple comparisons between the genotypes for each time point separately (*p < 0.05, **p < 0.01, ***p < 0.001). See also Figure S12.
