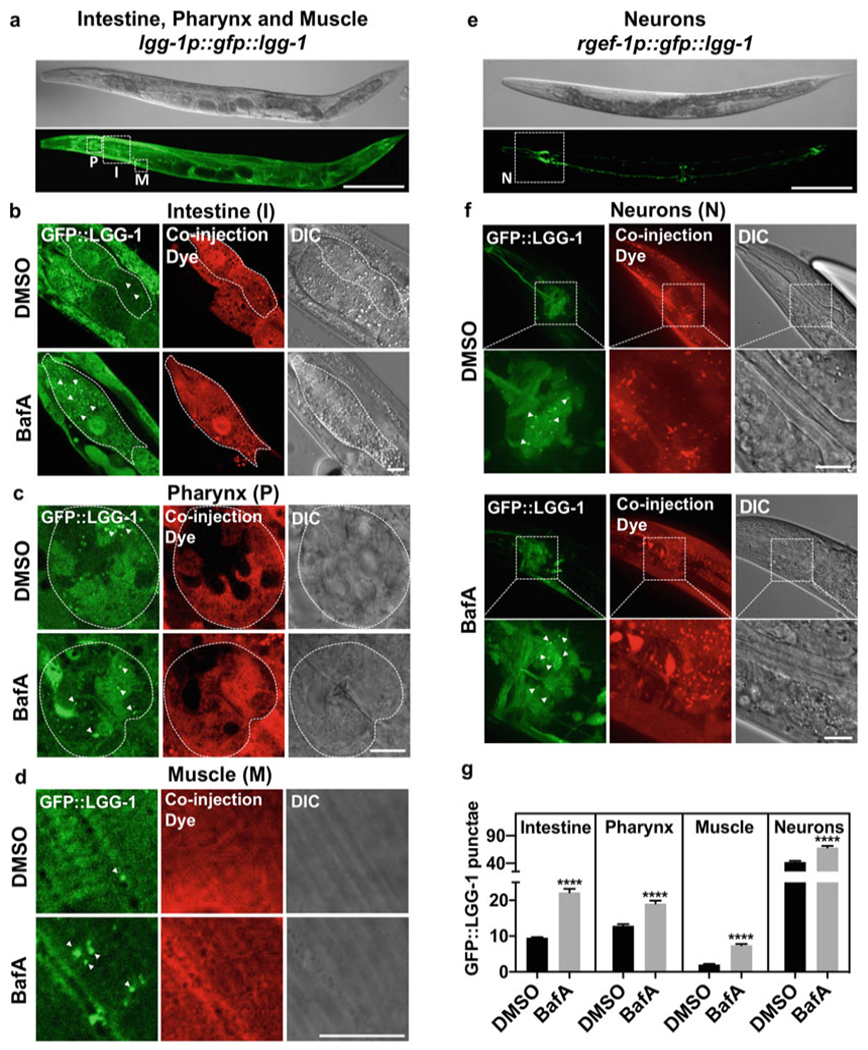
Fig. 2.

Autophagic flux analysis in select tissues of adult C. elegans. (a) Representative image of strain DA2123 (adIs2122[lgg-1p::gfp::lgg-1 + rol-6]) used to assess autophagic flux in intestine (I), pharynx (P), and muscle (M), outlined by dashed boxes. Scale bar 200 μm. (b–d) Representative images of GFP::LGG-1-positive punctae (green, some indicated by arrowheads) in lgg-1p::gfp::lgg-1-expressing animals (DA2123) injected with DMSO (DMSO) or Bafilomycin A (BafA) with coinjection dye (Dextran, Texas Red) and differential interference contrast (DIC) images are shown. Scale bar 10 μm. Animals shown were injected on day 1 of adulthood. Tissues examined included the intestine (b), pharynx (c), and body-wall muscle (d). (e) Representative image of strain MAH242 (sqIs24[rgef-1p::gfp::lgg-1 + unc-122p::rfp]) used to assess autophagic flux in nerve-ring neurons (N), outlined by a dashed box. Scale bar 200 μm. (f) Representative images of GFP::LGG-1-positive punctae (green) in regf-1p::gfp::lgg-1-expressing animals (MAH242) injected with DMSO (DMSO) or Bafilomycin A (BafA) with coinjection dye (Dextran, Texas Red) and differential interference contrast (DIC) images are shown. Scale bar 10 μm. Animals shown were injected on day 1 of adulthood. (g) Quantification of GFP::LGG-1 punctae in animals injected with DMSO (DMSO) or Bafilomycin A (BafA) on day 1 of adulthood. Data are the mean ± SEM of ≥25 animals combined from at least three experiments. ****p < 0.0001 by Student’s t-test. The data in this figure were published in Fig. 3, Supplement 3 of [9]
