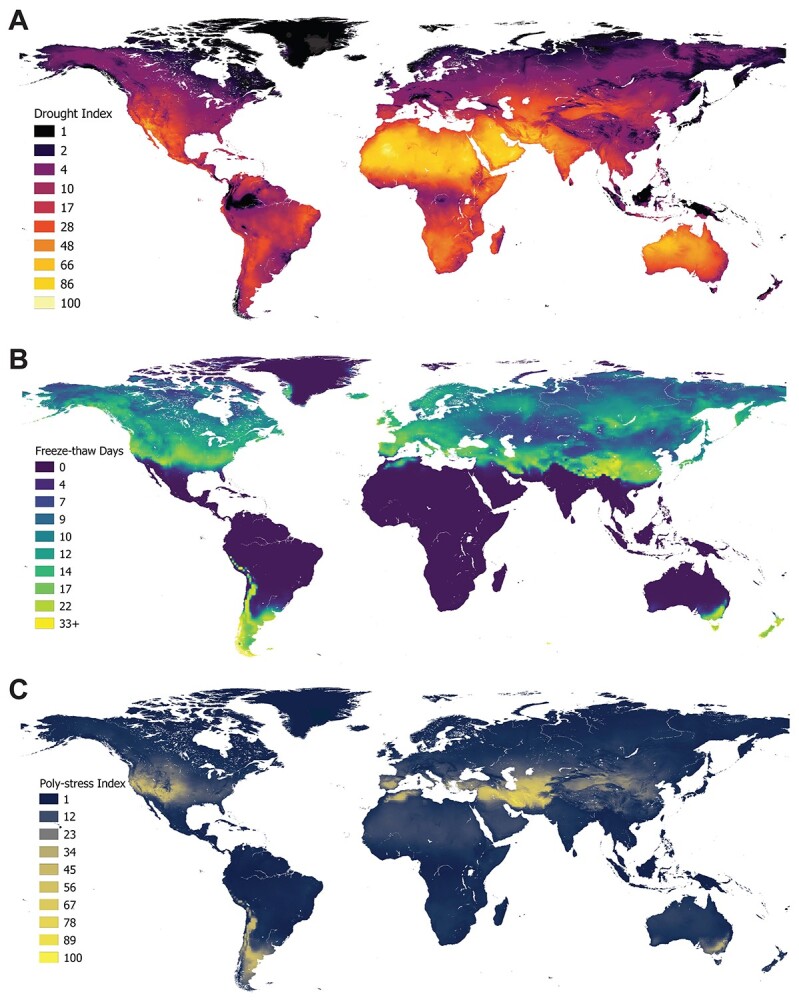
Figure 1.

Spatial distribution of (A) annual average Di, (B) number of freeze–thaw days and (C)a PSi based on their spatial overlap. Indices (A, C) range from 1 to 100 in order of increasing stress. Freeze–thaw days are shown in (B) for interpretability of common units (days), see Supplemental Methods for details about the conversion to the freeze–thaw index (FTi) used in other figures. Details of both indices (A, C) are described in the methods. Color thresholds were determined to maximize contrast.
