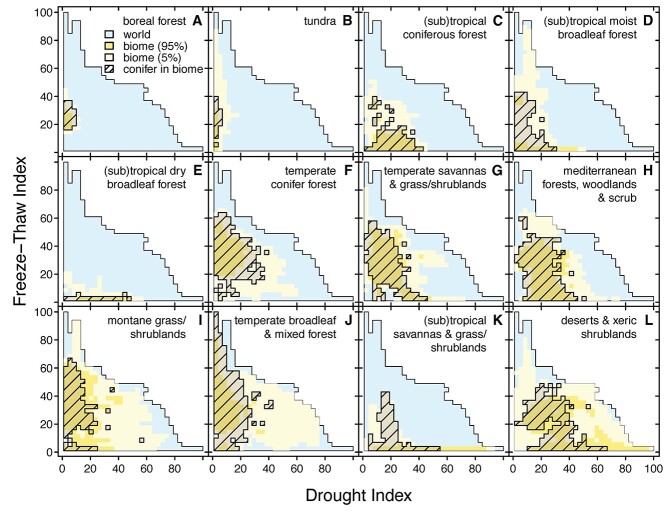
Figure 2.
The distribution of 12 major biomes in FTi–Di space, relative to the occurrence of all global landmass (excluding Antarctica - blue; ``world'') are shown in shades of yellow (“biome”). The darker shade indicates the bulk of common FTi–Di combinations (“biome 95%”), while the pale shade shows the remaining, rare combinations (“biome 5%”). Hatched regions indicate the reported occurrences of conifer species within each biome. Drought and freeze–thaw indices range from 1 to 100 in order of increasing stress. Each pixel is 3 × 3 index units. For every conifer species, we included it in a biome only if at least 5% or 10 observations were recorded in that biome.

