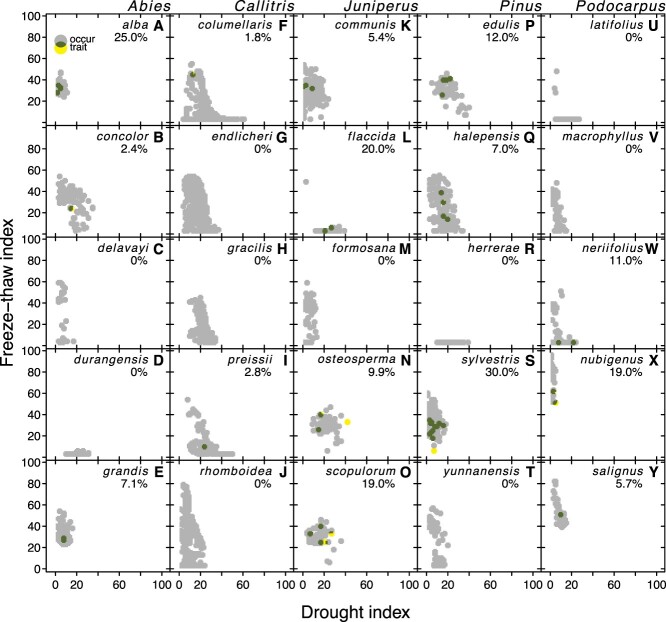
Figure 3.
The availability of occurrence data (grey; “occur”), trait data (yellow; “trait”) and their overlap (dark green) in FTi-Di space for five representative species in five representative genera. Each data point was rounded to the nearest FT and drought index and then buffered by a radius of two index units. The approximate completeness of trait data that is available relative to the environmental space that each species occupies was calculated as the area of yellow and dark green pixels divided by the area of yellow, dark green and grey pixels, and expressed as a percentage in the top right of each panel.

