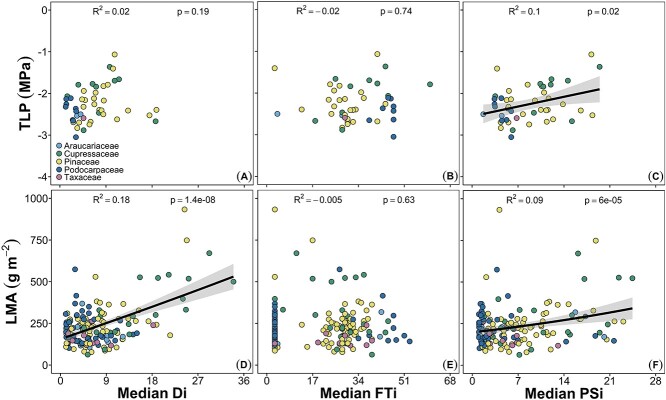
Figure 4.
Linear regression of mean species’ turgor loss point (TLP; n = 52) and LMA (n = 202) on median species’ occurrence on the drought (Di, A, D), freeze–thaw (FTi, B, E) and poly-stress (PSi, C, F) indices. Regression lines and 95% confidence intervals are presented where significant. The LMA data were not normally distributed and were log transformed. The regressions present in these panels are logarithmic. Each dot represents one species in the families indicated.

